Bounty Ended with 25 reputation awarded by CommunityBot
added 1158 characters in body
Source Link
João Farias
  • 11k
  • 2
  • 20
  • 40

Since you have Session-Based Test Management, you can use your test sessions data to show your team's testing capacity.

For example:

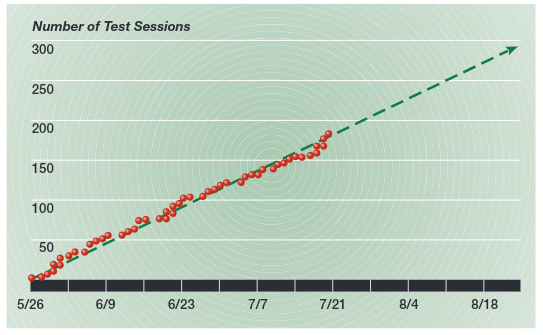
  • You can plot the number of sessions your team did throughout time. Downtrends may intigate your team is having problems to keep a steady pace or that your testability has improved, demanding less test sessions for the same results.

    Normalizing these data with other team capacity metrics, such as number of people involved or story points (if you can very consistent and mature with them) may make this chart more precise.

enter image description here

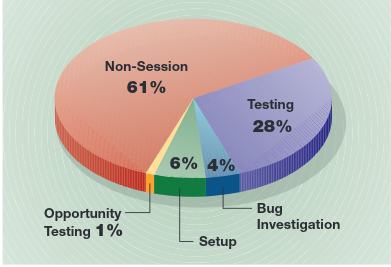
  • You can also breakdown the type of work done in each session, to tell a story about issues your team may face with testability and reportability.

enter image description here

You can find more details on James Bach's article on Session-Based Test Management.

Also, Kanban metrics may be useful:

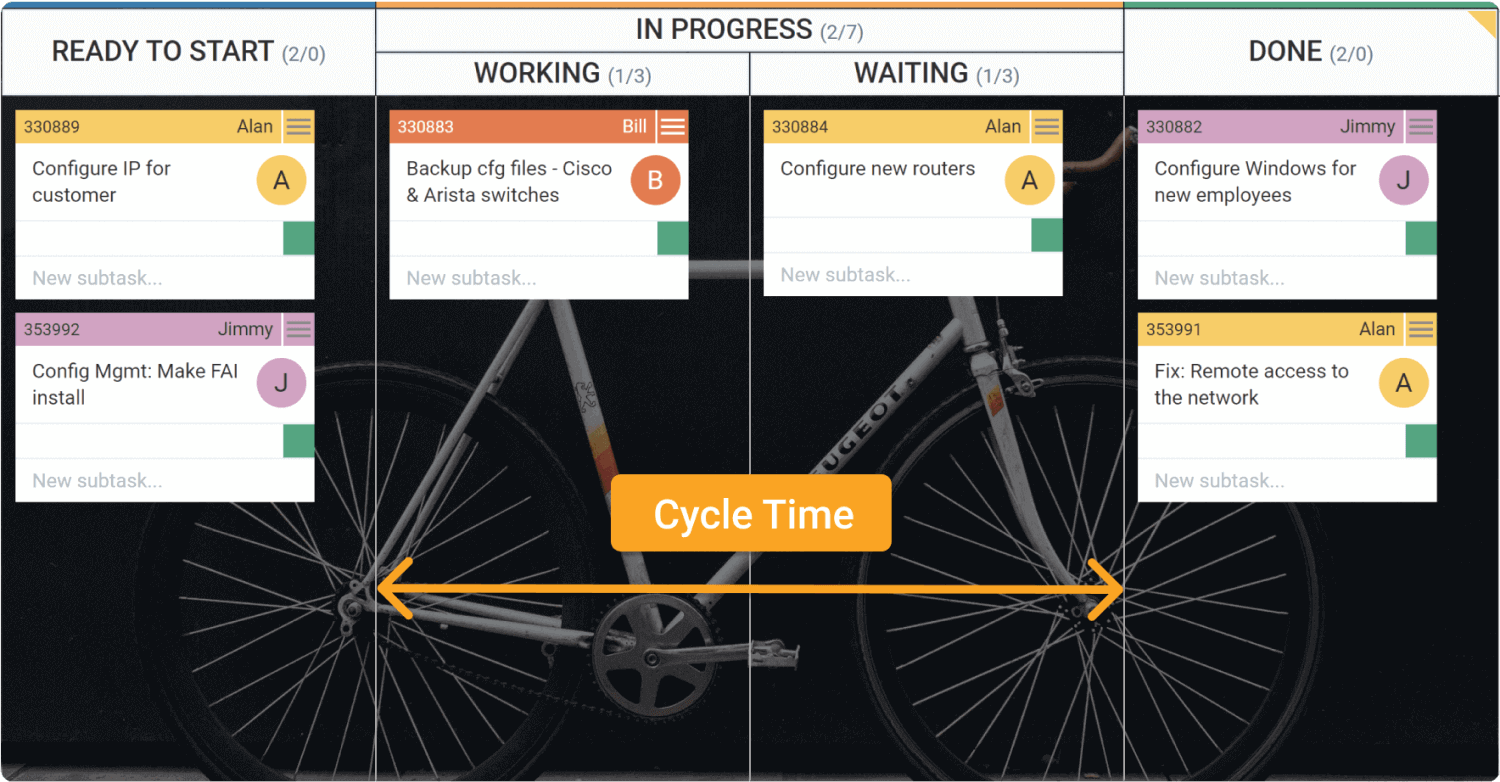
  • Cycle time will show how long your team takes to finish a task from the moment it starts.

enter image description here

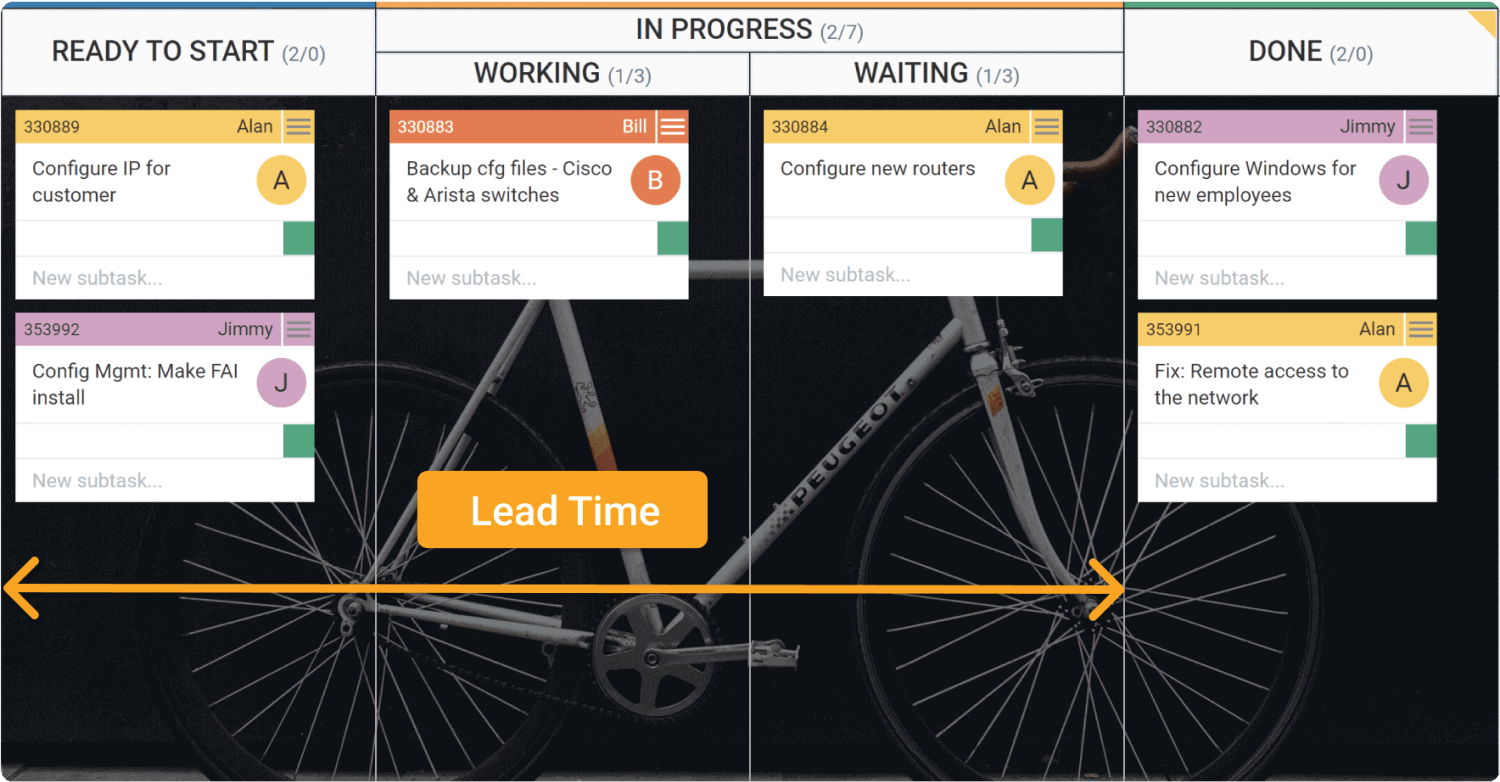
  • Lead time will show how long your team takes to finish a task from the moment it appears. It complements cycle time to show possible problems in keeping new business needs for too long before it starts to be worked on.

enter image description here

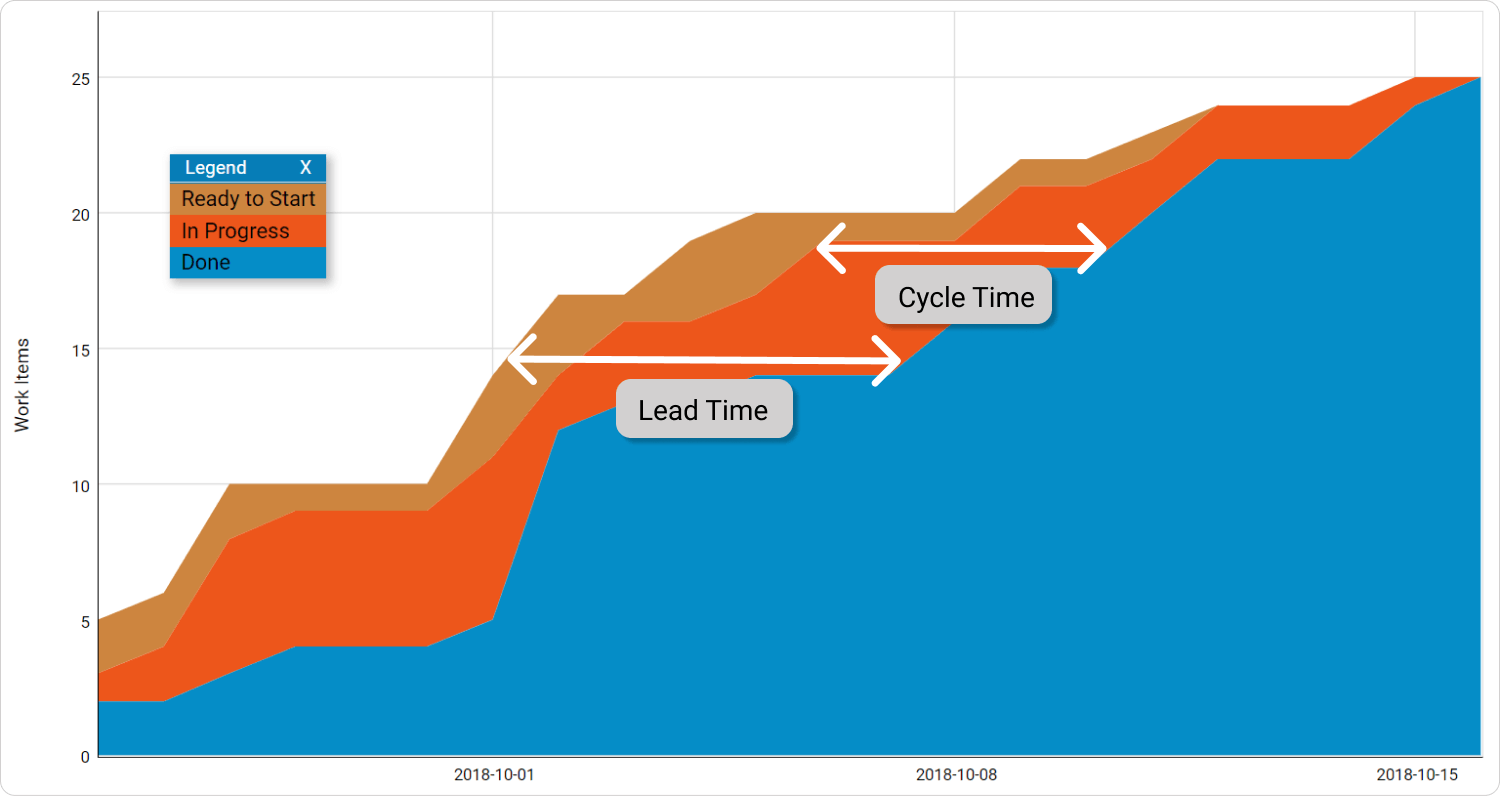
In the end, you can have a cumulative flow diagram. It indicates bottlenecks in a delivery pipeline. You can see below, at 2018-10-01, the In Progress color occupies a large part of the chart. It indicates your team was working in a lot of items at the same time, without delivering to Done. It would indicate you may have a story about people switching focus too often during the day, getting requests from many sources.

enter image description here

More details here.

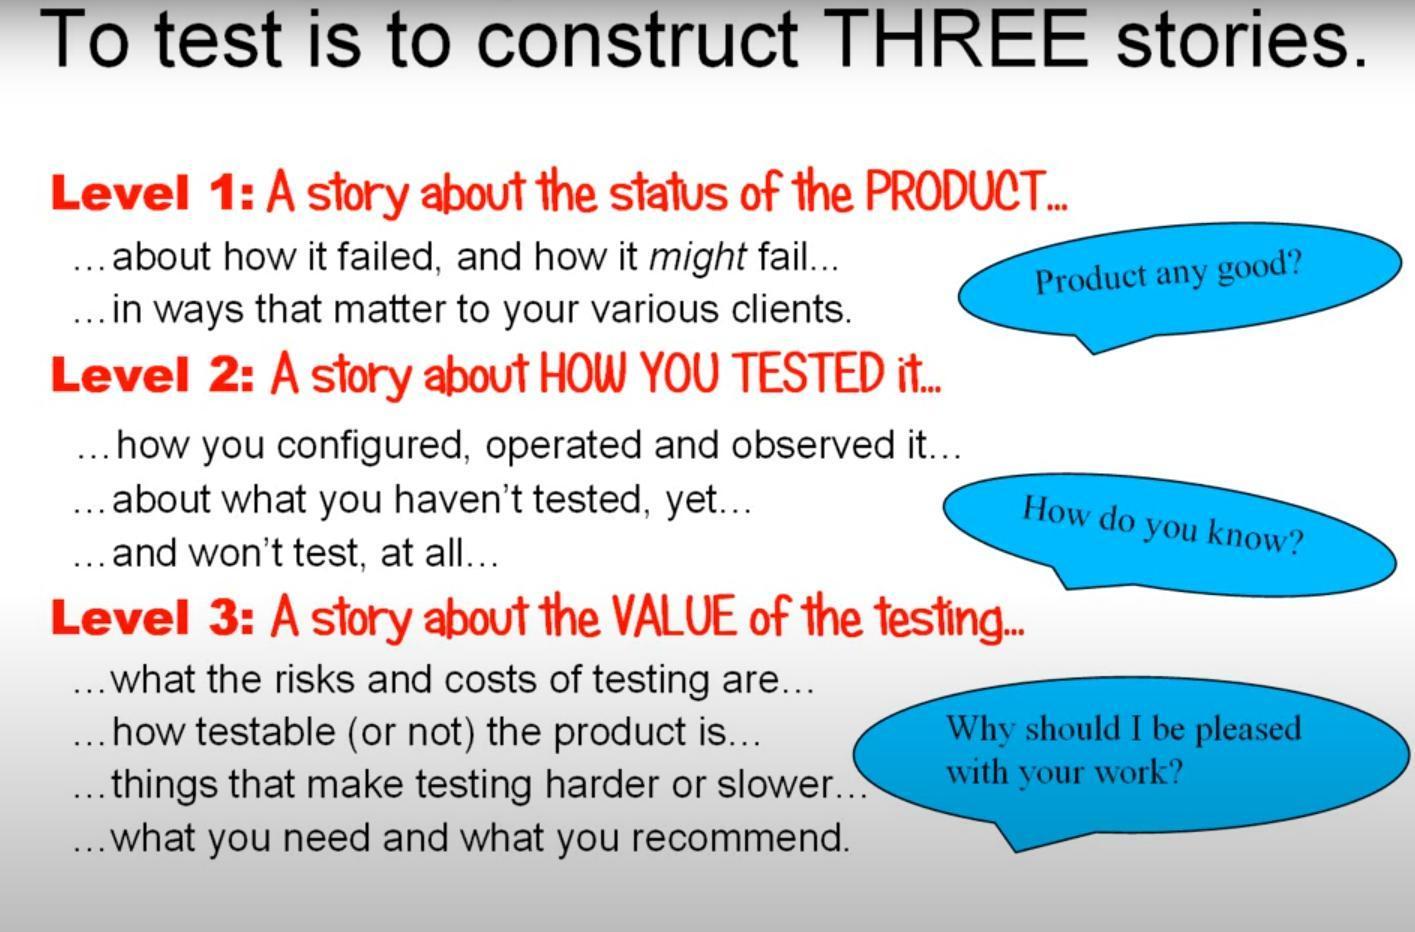
On a final note: Don't count lines of code or number of bugs. Use any data or chart you have to tell a story about testing. Focus on creating adaptability, optionallity, and experimentation. Identify what issues you have and see coming, and prepare yourself to remove those impediments to good testing. You may identity that you gonna need to put more effort in setting up better code quality analysis, or solve communication issues, or test labs issues. These problems may be solved be hiring people with new skills, or changing focus, or changing roles inside the team. You will know what works best to your particular context by experimenting, throughout time.
enter image description here

Since you have Session-Based Test Management, you can use your test sessions data to show your team's testing capacity.

For example:

  • You can plot the number of sessions your team did throughout time. Downtrends may intigate your team is having problems to keep a steady pace or that your testability has improved, demanding less test sessions for the same results.

    Normalizing these data with other team capacity metrics, such as number of people involved or story points (if you can very consistent and mature with them) may make this chart more precise.

enter image description here

  • You can also breakdown the type of work done in each session, to tell a story about issues your team may face with testability and reportability.

enter image description here

You can find more details on James Bach's article on Session-Based Test Management.

On a final note: Don't count lines of code or number of bugs. Use any data or chart you have to tell a story about testing. Focus on creating adaptability, optionallity, and experimentation. Identify what issues you have and see coming, and prepare yourself to remove those impediments to good testing. You may identity that you gonna need to put more effort in setting up better code quality analysis, or solve communication issues, or test labs issues. These problems may be solved be hiring people with new skills, or changing focus, or changing roles inside the team. You will know what works best to your particular context by experimenting, throughout time.
enter image description here

Since you have Session-Based Test Management, you can use your test sessions data to show your team's testing capacity.

For example:

  • You can plot the number of sessions your team did throughout time. Downtrends may intigate your team is having problems to keep a steady pace or that your testability has improved, demanding less test sessions for the same results.

    Normalizing these data with other team capacity metrics, such as number of people involved or story points (if you can very consistent and mature with them) may make this chart more precise.

enter image description here

  • You can also breakdown the type of work done in each session, to tell a story about issues your team may face with testability and reportability.

enter image description here

You can find more details on James Bach's article on Session-Based Test Management.

Also, Kanban metrics may be useful:

  • Cycle time will show how long your team takes to finish a task from the moment it starts.

enter image description here

  • Lead time will show how long your team takes to finish a task from the moment it appears. It complements cycle time to show possible problems in keeping new business needs for too long before it starts to be worked on.

enter image description here

In the end, you can have a cumulative flow diagram. It indicates bottlenecks in a delivery pipeline. You can see below, at 2018-10-01, the In Progress color occupies a large part of the chart. It indicates your team was working in a lot of items at the same time, without delivering to Done. It would indicate you may have a story about people switching focus too often during the day, getting requests from many sources.

enter image description here

More details here.

On a final note: Don't count lines of code or number of bugs. Use any data or chart you have to tell a story about testing. Focus on creating adaptability, optionallity, and experimentation. Identify what issues you have and see coming, and prepare yourself to remove those impediments to good testing. You may identity that you gonna need to put more effort in setting up better code quality analysis, or solve communication issues, or test labs issues. These problems may be solved be hiring people with new skills, or changing focus, or changing roles inside the team. You will know what works best to your particular context by experimenting, throughout time.
enter image description here

Source Link
João Farias
  • 11k
  • 2
  • 20
  • 40

Since you have Session-Based Test Management, you can use your test sessions data to show your team's testing capacity.

For example:

  • You can plot the number of sessions your team did throughout time. Downtrends may intigate your team is having problems to keep a steady pace or that your testability has improved, demanding less test sessions for the same results.

    Normalizing these data with other team capacity metrics, such as number of people involved or story points (if you can very consistent and mature with them) may make this chart more precise.

enter image description here

  • You can also breakdown the type of work done in each session, to tell a story about issues your team may face with testability and reportability.

enter image description here

You can find more details on James Bach's article on Session-Based Test Management.

On a final note: Don't count lines of code or number of bugs. Use any data or chart you have to tell a story about testing. Focus on creating adaptability, optionallity, and experimentation. Identify what issues you have and see coming, and prepare yourself to remove those impediments to good testing. You may identity that you gonna need to put more effort in setting up better code quality analysis, or solve communication issues, or test labs issues. These problems may be solved be hiring people with new skills, or changing focus, or changing roles inside the team. You will know what works best to your particular context by experimenting, throughout time.
enter image description here