12

I have a test matrix for my product's installation, which is n-dimensional, where n is about 11 or 12 at this point. For instance, the OS is one dimension, and the DB is another, and the Reporting engine is a third etc. In this matrix, every intersection of these parameters is a separate test that needs to be run and reported.

How can I display these results so that they can be easily reviewed to see which tests have been run/passed/failed?

4 Answers 4

12

enter image description here

Solution Overview

To solve this problem, you will want to intelligently select a manageable set of combinations based on a pairwise coverage approach (explained below) or a more thorough variation of combinatorial test design.

Glowcoder and user246 have good points. I particularly like testerab's comment for reasons that will become clear in a minute.

I've created a relatively detailed sample plan to your specific problem and am making it available to anyone who would like to see it here: https://app.hexawise.com/share/JJNP37PJ (Apologies that registration is required to access it which is admittedly a bit of a nuisance; the good news is that registration is quick and free). You'll be able to edit my sample plan, replace my sample place-holder test inputs your actual test inputs, and quickly generate tests to solve your problem.

I have intensely studied test design problems like this one you've raised for the last 5 years. I have published articles and presentations about the benefits of the following approach to test design, collaborated with PhDs who specialize in maximally efficient test design, spoken at testing conferences extolling the benefits of this approach, and created the Hexawise test case design tool to make it easy for testers to automatically generate tests that solve for precisely the kinds of combinatorial explosions like the one you're talking about here. You could rightly say I've been obsessed with understanding this puzzle and trying to do my best to help others understand the most efficient and effective ways to address it. From my experiences and studies, this is what I would recommend:

Specific Solution (With Example)

First, you need to identify your test inputs. (I've borrowed a few ideas from glowcoder's answer) in my sample test plan's inputs in the plan shown here:
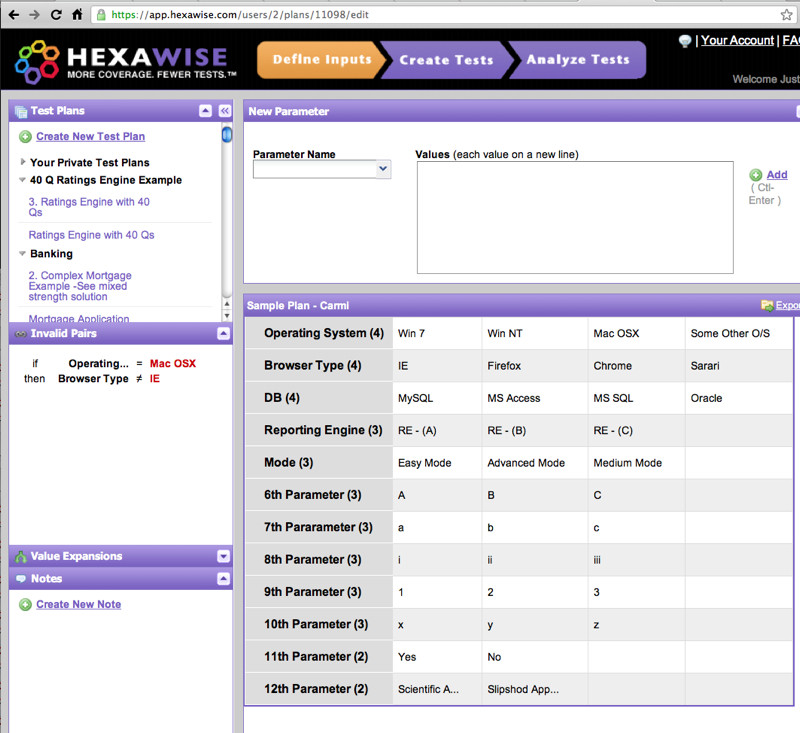
Test Inputs

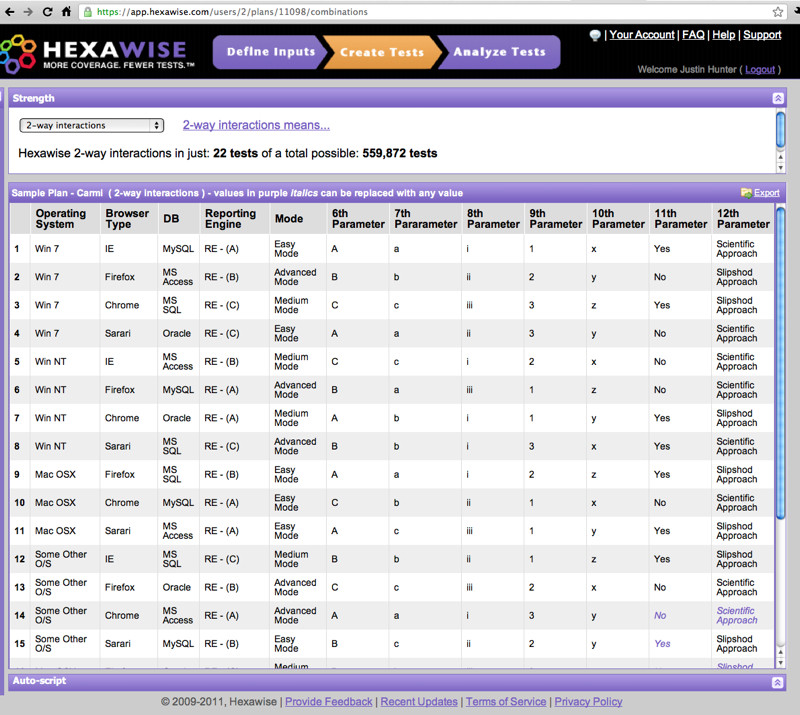
Once you've done that, click on the "Create Tests" button to create a set of pairwise tests. You'll see that there are 559,872 possible test cases. From those, Hexawise identifies the smallest possible set of tests it can create to ensure that every single possible pair of test inputs are tested together in at least one test case. Believe it or not, it takes only 22 tests do do so. Technically, every single pair of test inputs appears except for one pair of values. The missing pair was intentionally removed from the solution because it would have been impossible for a tester to execute; the Invalid Pair that does not appear in the solution is O/S = Mac OSX tested together with Browser = IE.
enter image description here

Coverage Report

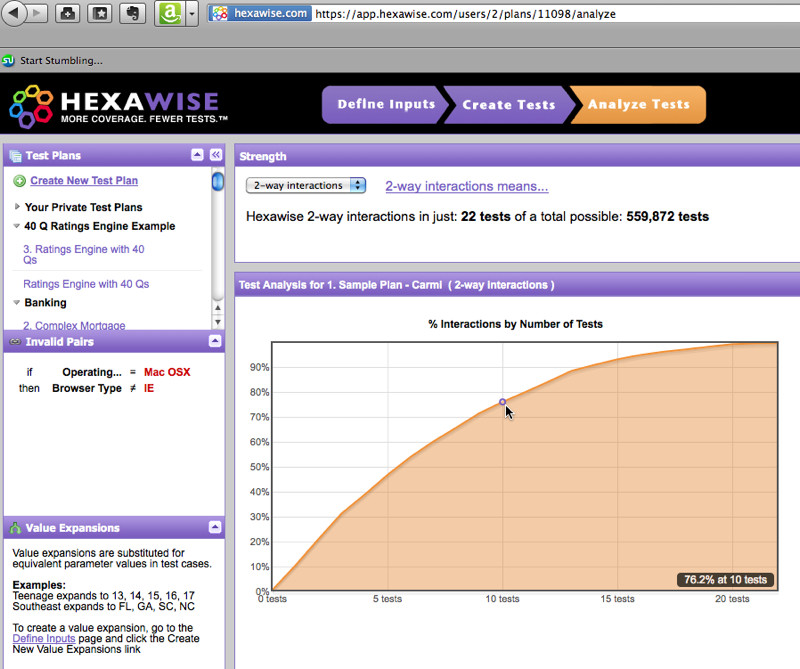
If you click on the "Analyze Tests" feature, it will take you to a screen that will make you happy based on your question. It will show what percentage of those combinations have been covered at each point in your test plan. After just ten tests, 76.2% of the potential pairs of values that exist in the System Under Test will already have been tested together in at least one test case.
enter image description here

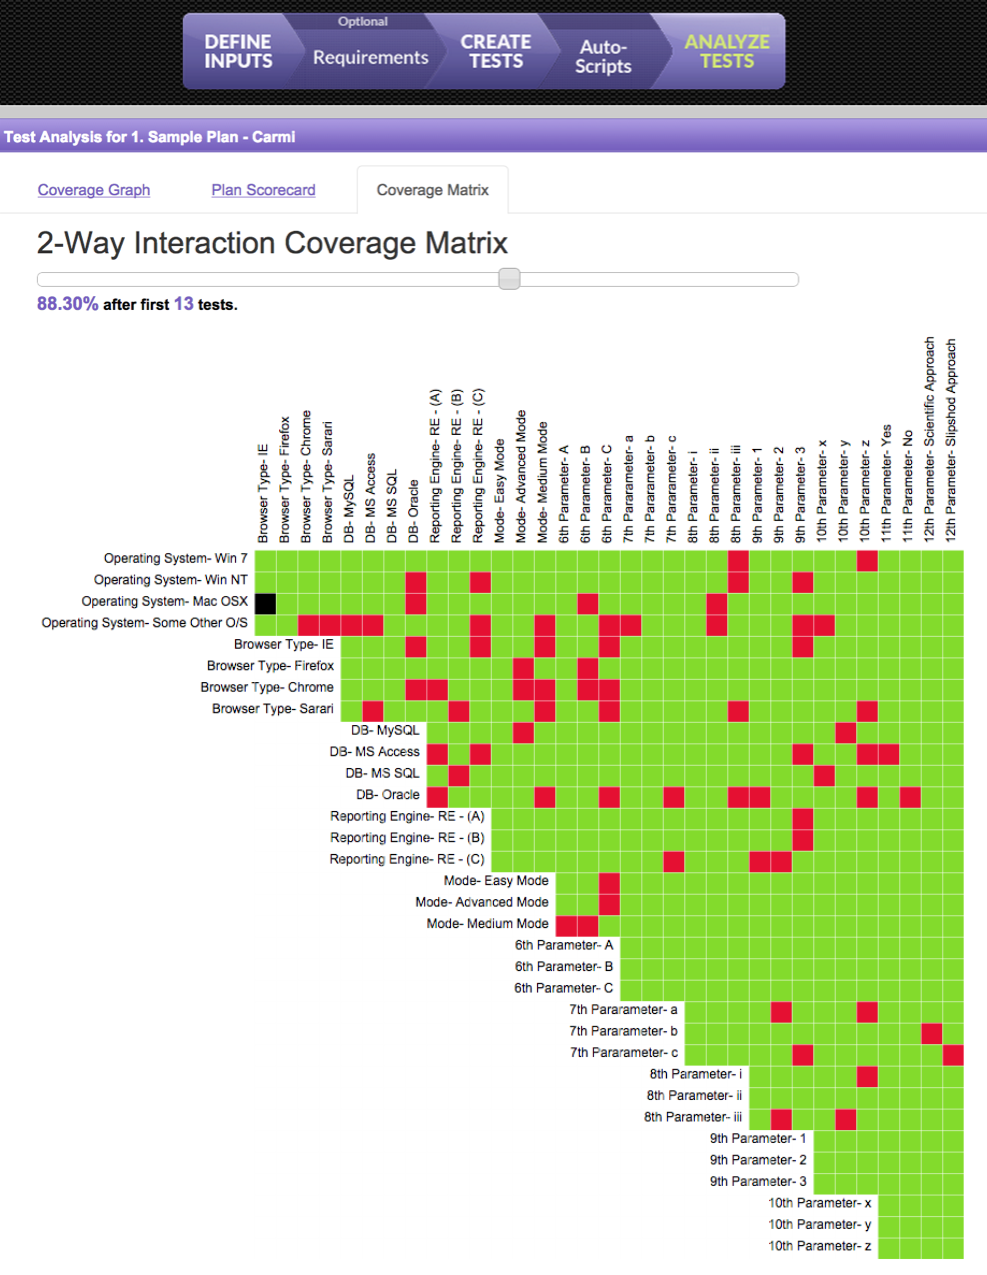
Those first ten tests will find a large percentage of the bugs in the System Under Test (and the 22 may well find a few additional ones). From there, the marginal return on your tests will fall significantly for the simple reason that defects that can only be triggered by specific combinations of 3 or more variables are quite rare. This chart shows the specific coverage gaps that would exist if you stopped executing tests after your first 13 tests:
enter image description here

Having said that, if you'd like to achieve more thorough coverage than those unusually powerful initial 22 tests, that is easily achievable as well. You can select "3-way" coverage on the drop down menu on the Create Tests screen. You'll find that only 95 tests are required to test for every single possible combination of 3 values that are in the plan. (4-way coverage would require 359 tests, etc. The point is, you can turn the coverage dial up or down to meet your thoroughness objectives).

Some good, succinct information about pairwise test design methods, combinatorial testing, the Hexawise tool, Design of Experiments-based software test design methods, and orthogonal array (AKA OA or OATS)-based test design methods can be found in the links cited here (<---- informational links including articles, and an amusing and insightful set of pohtograph-rich, introductory PowerPoint slides.)

I hope this answer helps.

3
  • Hexawise looks good, and it clearly would help in terms of identifying what tests to run and how to achieve good coverage. However, the OP's question centers around reporting the results of such testing. Commented May 12, 2011 at 11:09
  • Simon, I've added a couple screen shots to my answer which hopefully makes it significantly more clear. The final screen shot is the coverage screen. It shows that 100% of the pairs of values in the plan are covered by the 22nd test and that, if someone wanted to create 10 quick "smoke tests" even those first ten tests would test for 76.2% of all the possible pairs of test inputs that exist within the System Under Test. The same type of coverage charts can be made for "what percent of triples have been tested?" as well. Thanks. Commented May 13, 2011 at 19:13
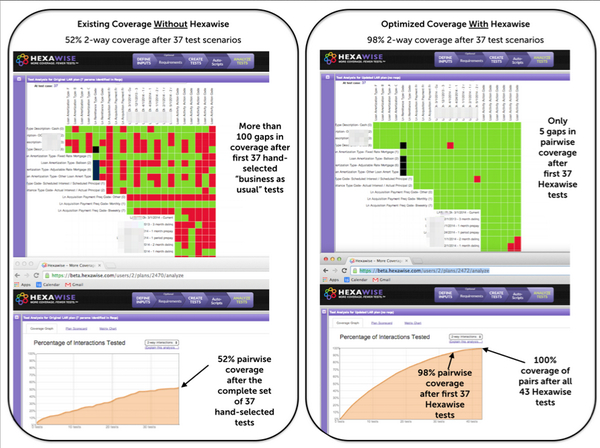
  • I've added some new screen shots of the green and red "Matrix Reports" because some testers like how they provide a clear summary coverage achieved as well as specific gaps in coverage that exist. (These views were not previously available).
    – Justin
    Commented Jan 27, 2015 at 21:04
4

How to do it

Let's let your dimensions' sizes be C1, C2 ... Cn where n is the number of dimensions. So, C1 might be 3 if your values are Windows, Mac, Linux (I'm sure you'd have different versions of Windows and what not, but for the example, it works.) Your total number of tests will be C1 * C2 * ... * Cn.

I'm sure you already have a 2d matrix defined that is your set of labels.

I personally would export it to a CSV so you can open it up in Excel (or your favorite spreadsheet.) Here's a 4 dimensional example. Having the row headers allows you to easily sort the data by the various columns. If you had done so here, you would notice the "Advancde mode" always fails due to some typo in the DDL.

Test No.    OS        DB      RepEngine  Easy/Adv mode     Result     Notes
0001        Windows   MySQL   Velocity   Easy              PASS       
0002        Windows   MySQL   Velocity   Advanced          FAIL       Schema failure on table AdvancedModeSettings.
0003        Windows   MySQL   Crystal    Easy              PASS
0004        Windows   MySQL   Crystal    Advanced          FAIL       Schema failure on table AdvancedModeSettings.

I imagine you wouldn't even necessarily need to spit it out to csv (although it wouldn't be a bad idea.) You could keep a tab on the number of tests for each variable. Your result summary output might say (assuming we did the entire run)

OS:
  Windows  - 50%
  Mac      - 50%
  Linux    - 25%

Database:
  MySQL    - 42%
  Derby    - 42%

Reporting Engine:
  Velocity - 50%
  Crystal  - 33%

Easy/Adv mode:
  Easy     - 83%
  Advanced - 0%

Okay, well we obviously have a glaring mistake with Advanced mode. So with two choices for that mode, it it's obvious why so many types are hovering at 50% - half of them always failed.

Now, we take a look at reporting engine: Velocity passed 50% of the time, but crystal only 33% of the time. Since we've reduced its max to 50%, this indicates that 33/50 = 2/3, so its incompatible with something that has 3 choices and passes 2 of them. We scroll up to OS and find that Linux is down to 25% from the rest being at 50%. Looks like we spotted it: Crystal reports on Linux seems to be failing the install.

That's an idea of the information you could glean. You could write a small script to make some smart guesses about those kinds of information so you know what to look for. Obviously, just the fact that a low percentage of one passes means you have a reason to investigate it.

Reality Check

Now, with 12 dimensions, and about 5 choices per dimension, you're looking at about 244 million tests. I don't even think that's feasible to run. Even at only 3 per choice you're looking at over half a million tests. I still think that's a lot. Unless you have a massive server farm. You can't really expect an install to take less than 10 minutes, can you? Plus you have to completely clean up after yourself too. That would be over 88 thousand hours of server time. I'm not convinced simply making a twelve-nested loop would be a wise idea. :-)

4
  • 3
    The breakdown by OS is important because those could be released separately. I once worked for a place where the drivers had to support about 40 different operating systems. The numbers add up very fast when you consider 32 vs 64 bit windows versions, as well as Itanium and Alpha, as well as all the different flavors of linuxes, unixes and mainframes getting supported. Generally you'll want to do a "drill down" report to let the viewers determine what they want to see in the vast sea of combinations.
    – Tangurena
    Commented May 8, 2011 at 19:37
  • I second Tangurena's comment. Drilldown reports are very handy for displaying this kind of information. Commented May 10, 2011 at 18:31
  • 1
    Yes, Excel's PivotTables are good for looking at results like this assuming you have 100% coverage across all dimensions. Working out what figures to show with pairwise results will be more complicated. Commented May 12, 2011 at 11:10
  • I had the same issue as Tangurena in that I was supporting a Filter Driver on about 40 different environments, the numbers sure built up FAST!
    – MichaelF
    Commented Nov 3, 2011 at 15:10
4

Do all combinations need to be run? This sounds like a classic place to apply all-pairs testing. I haven't played with this yet myself, but I hear good things about Hexawise which might help with display and analysis of the results.

1
  • This is what I was thinking! I've never used it either, but all pairs or something similar sounds promising. Commented May 10, 2011 at 18:30
2

You need to reduce your 11- or 12-dimensional cross product into a manageable number of combinations. I have had some luck using all-pairs (see http://en.wikipedia.org/wiki/All-pairs_testing) testing. Once you reduce your test space using all-pairs, you ought to be able report the results in a spreadsheet.

Your Answer

By clicking “Post Your Answer”, you agree to our terms of service and acknowledge you have read our privacy policy.

Not the answer you're looking for? Browse other questions tagged or ask your own question.