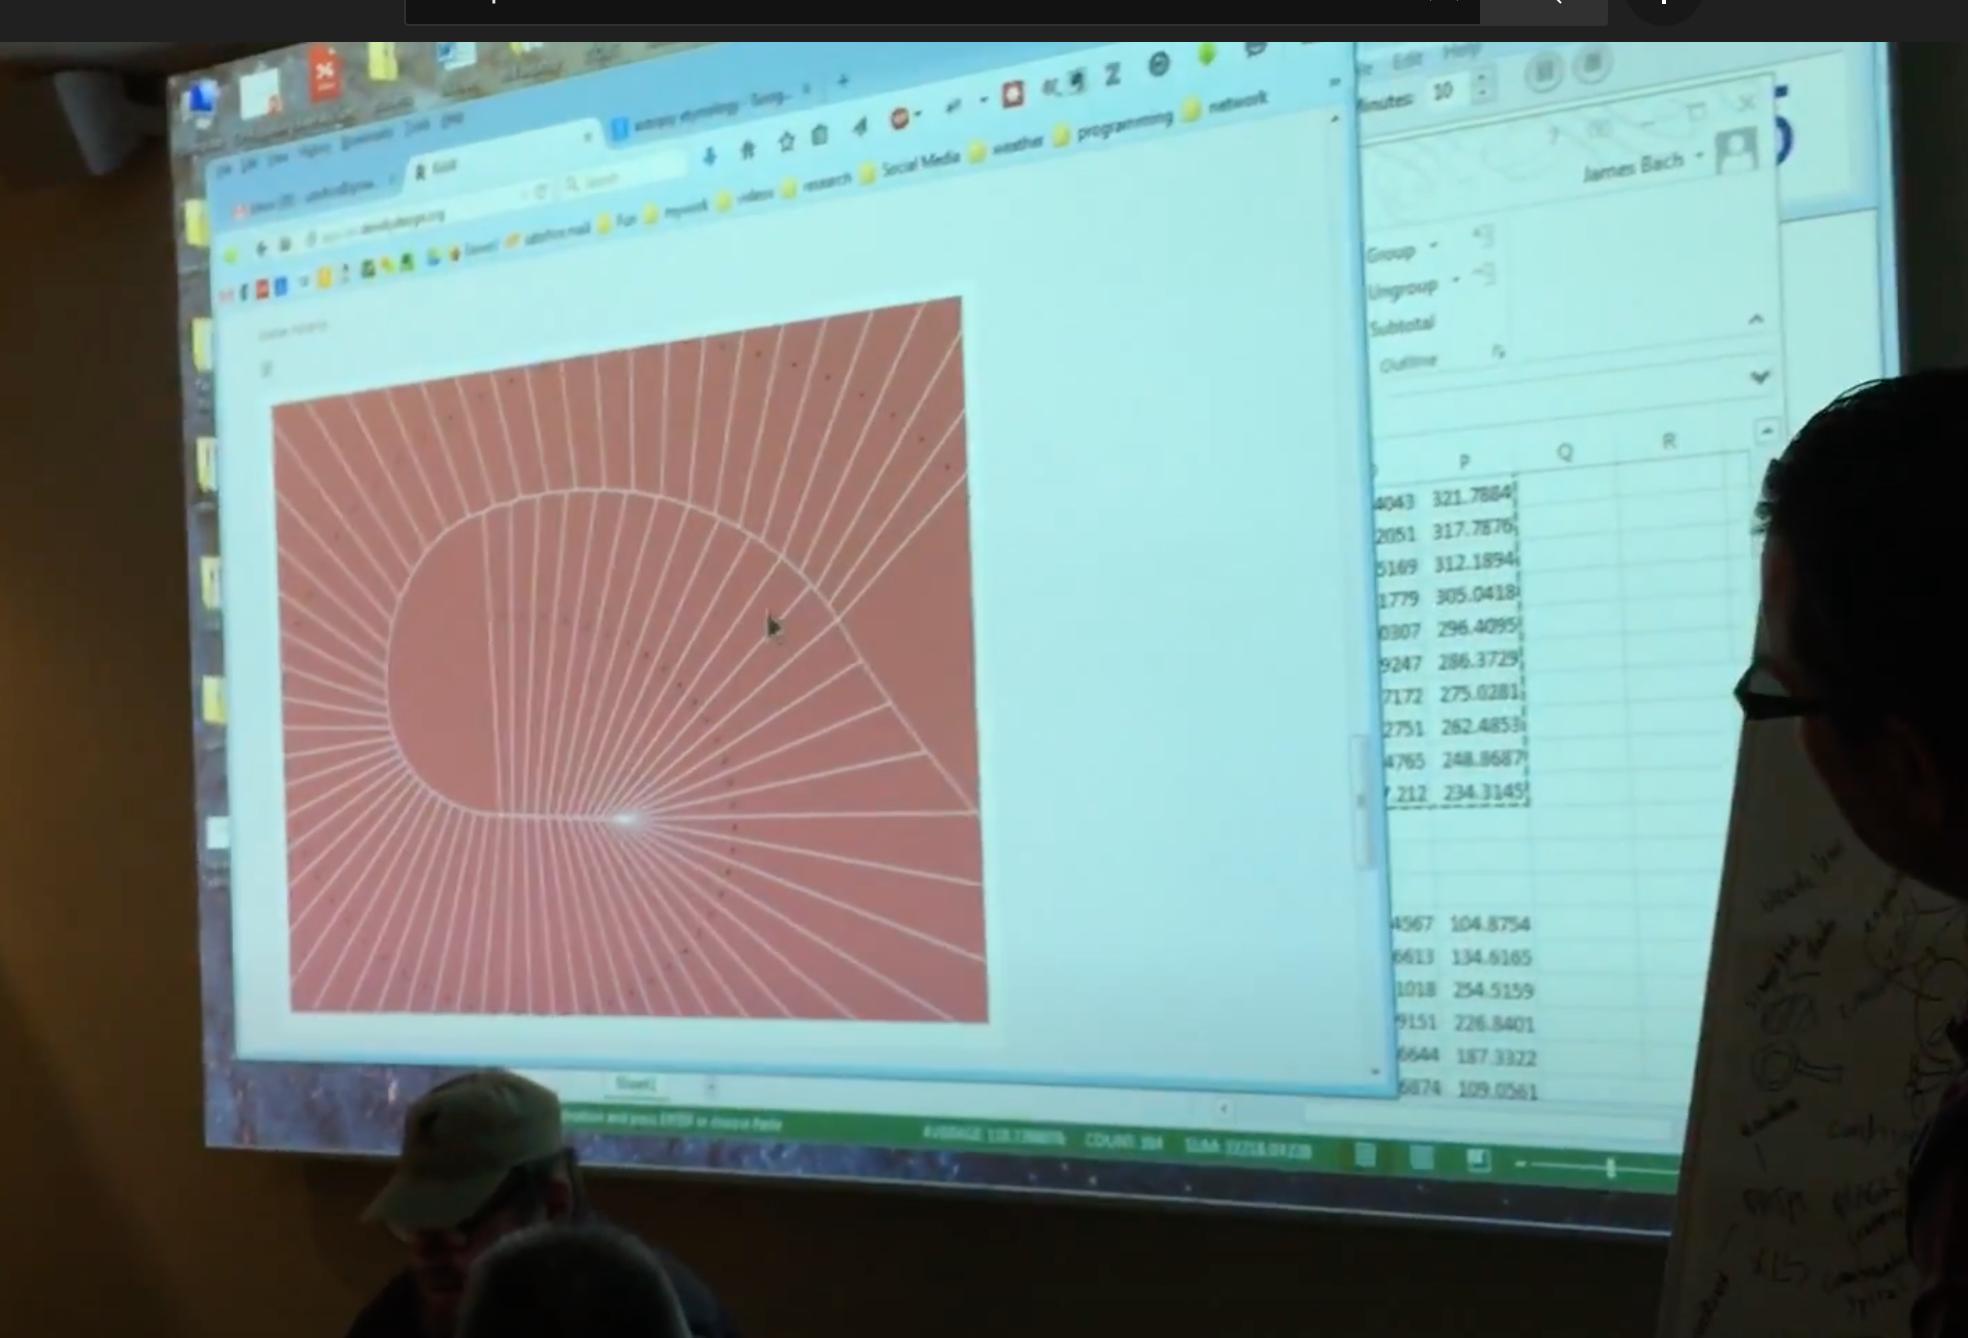
In my project, we have a module called Reporting which covers graphs and charts.
It's basically a dashboard on the homepage of the website with multiple graphs and charts (after inspecting them they are seen to be made of <CANVAS & <SVG tags
They are representing Data from a DataSource.
Manual Test Cases defined are validating that the data represented by the graphs and charts are correct in 2 areas.
- Quantification - Value represented in graph and chart
- Quality - visual design of chart and graph
How to approach test automation of such test cases? Can we achieve 100% automation in such modules?
