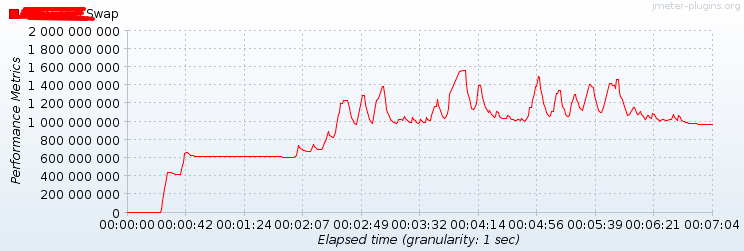
I have been monitoring server side performance. I got some graph based on the reading, but I am not able to figure out the unit on the y-axis numbers. Is the CPU utilization calculated in % or some other unit? And what about memory, Network I/O, Swap memory??? Can any one suggest something.
Add a comment
|
1 Answer
For particular your image Y axis stands for Swap (page) file usage in bytes depending on chosen metric which could be one of:
- used
- pagein
- pageout
- free
- total
You can calculate percentage for swap file as used/total * 100. For other metrics you will need to play the same trick.
See How to Monitor Your Server Health & Performance During a JMeter Load Test article for more information on monitoring server-side performance counters with PerfMon