0

I created a test script to sign in and sign out an application and tested the script with a single user.

The aggregate report shows average time as 72 secs for sign out for just 1 user. But when I manually sign out the application, it is getting done in 2 seconds itself.

Why is this?
2 Answers 2

0

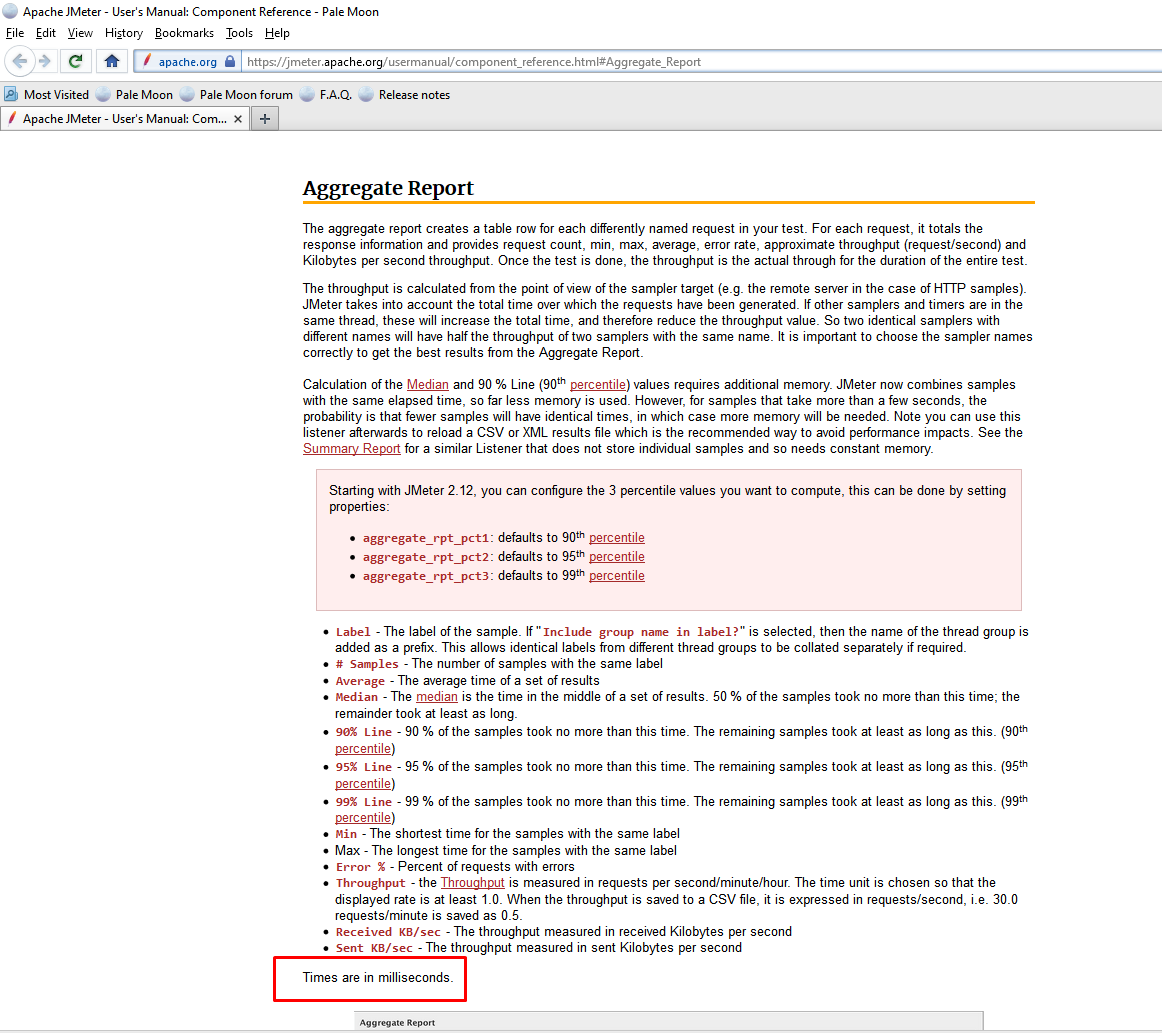
Are you absolutely sure that the Aggregate Report shows 72 seconds? As per documentation

Times are in milliseconds.

enter image description here

If it really takes more than a minute to log in compare the requests which are being sent by the real browser with the ones which JMeter sends, you need to configure JMeter to behave 100% like a real browser, in this case you should get similar/same results.

1
  • Thank you for responding. Yes, I am very sure the sign out transaction (which contains only 1 request) is taking more than a minute (Average - 151637 ms). I am recording the script using blazemeter chrome extension and the script automatically comes with the configuration to behave like a real browser. But still, i see a huge difference between real browser and jmeter.
    – Rohit
    Dec 2, 2021 at 18:33
0

The average time reported in the aggregate report for sign out being 72 seconds for 1 user is significantly higher than what is seen in manual testing. There could be several reasons for this discrepancy.

  1. Network Latency: Network latency can have a significant impact on the response time of a request. JMeter sends requests from its machine and waits for the response. If there is high network latency between JMeter and the application server, it can result in slower response times.

  2. Load on the Application: The application could be under heavy load during the JMeter test, leading to slower response times.

  3. JMeter overhead: JMeter itself can add overhead to the test as it consumes resources on the machine running the test and also needs to process the requests and responses. This can result in longer response times.

  4. Timing Configuration: The timing configuration in the test could be incorrect. For example, if there is a think time set in the script which is significantly higher than the actual time taken to complete a task, it will result in higher average times in the aggregate report.

  5. Measurement inaccuracies: Finally, measurement inaccuracies can occur due to the limitations of JMeter or the method used for manual testing.

It is important to identify the cause of the discrepancy and take appropriate steps to address it. This can involve checking the network latency, verifying the load on the application, optimizing the JMeter test, and ensuring the correct timing configuration is used. Additionally, it may be helpful to use other tools to validate the results and compare them to the JMeter aggregate report.

You may want to consider the following steps to improve the accuracy of your results:

  1. Ensure that you are using the appropriate timer, such as the Constant Timer, to control the pace of your requests.

  2. Make sure that your test script accurately reflects the steps you manually took.

  3. Reduce the number of resources that JMeter is consuming, such as reducing the number of threads or listeners.

  4. Ensure that you are using the latest version of JMeter and have optimized the JVM options.

  5. If possible, compare the results of manual testing with those of multiple test runs in order to get a more accurate picture of performance.

Your Answer

By clicking “Post Your Answer”, you agree to our terms of service and acknowledge that you have read and understand our privacy policy and code of conduct.

Not the answer you're looking for? Browse other questions tagged or ask your own question.