4

I am using Jmeter (started using it a few days ago) as a tool to simulate a load of 300 threads using a csv data file that contains login credentials for 3 system users.

This objective is to measure 300 users (threads) logging in and navigating to a page via the menu over a time span of 300 seconds.

I have set my thread group as:

Number of threads: 300
Ramp-up Perod: 300
Loop Count: 100

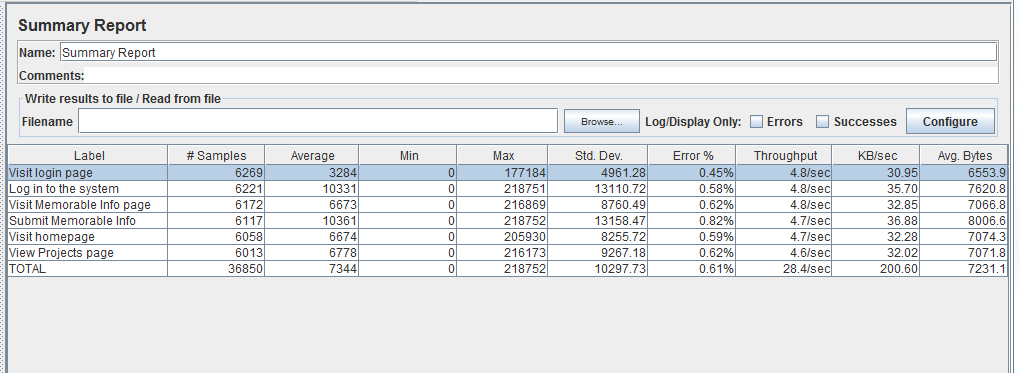
I ran the test successfully. Now I'd like to understand what the results mean and what is classed as good/bad measurements, and what can be suggested to improve the results. Below is a table of the results collated in the Summary report of Jmeter.

Can anyone help me understand these results?

enter image description here

3 Answers 3

3

In regards to you screenshots in general and Summary Report in particular, as per The Load Reports guide the explanation of the report fields is:

  • # Samples is the number of samples with the same label.
  • Average is the average time of a set of results.
  • Min is the shortest time for the samples with the same label
  • Max is the longest time for the samples with the same label
  • Throughput is is measured in requests per second/minute/hour. The time unit is chosen so that the displayed rate is at least 1.0. When the throughput is saved to a CSV file, it is expressed in requests/second, i.e. 30.0 requests/minute is saved as 0.5.
  • Kb/sec is throughput measured in Kilobytes per second. Time is in milliseconds.
  • Std.Dev is Standard Deviation - a measure of the variability of a data set. JMeter calculates population standard deviation (STDEVP function analogue)
  • Avg. Bytes - arithmetic mean of response bytes for the samples with the same label.

What looks weird:

  1. Minimum response time of 0 for a HTTP Request doesn't look realistic to me
  2. Average response is around 7KB for any request. Are you sure you aren't hitting the same page all the time?
  3. Same for other fields like throughput, kb/sec, etc. Try running your scenario with 1 user/1 loop in GUI mode and having View Results Tree Listener added and enabled to inspect responses and render HTML.

What further analysis steps I can recommend:

  1. Apart from looking into Summary Report you can use JMeter Plugins to generate nice looking and easy readable graphs
  2. Use PerfMon plugin to collect metrics on Application Under Test server side to ensure that it is healthy enough and has capacity and what is the impact of the load test.
  3. Use services like http://loadosophia.org/ which simplify results analysis processes
4
  • Thank you for your comment Dmitri. Would it be possible to help explain how I would calculate, 1) the mean value, 2) the standard deviation using these results? Are the results listed in milliseconds, i.e. Average, Min, Max, Std. Dev.? Commented Nov 6, 2014 at 17:18
  • You can use Aggregate Report or Summary Report for calculation, just open JMeter GUI, add above listener and open .jtl file with results. Mean calculation is as simple as response times of all requests divided by requests count. For standard deviation see Wikipedia article en.wikipedia.org/wiki/Standard_deviation or JMeter's Calculator class source svn.apache.org/repos/asf/jmeter/trunk/src/core/org/apache/…
    – Dmitri T
    Commented Nov 10, 2014 at 5:39
  • @DmitriT, Isn't the Load Report (your first link) referring to Blazemeter's Load Report? This isn't the same as JMeter's Load Report isn't it?
    – Pacerier
    Commented Oct 7, 2015 at 8:11
  • Almost the same with few extra metrics: a.blazemeter.com/report/r-ec528242f1e891d
    – Dmitri T
    Commented Oct 7, 2015 at 15:18
0

There are lots of explanation of Jmeter Summary,

Jmeter:Understanding Summary Report

This is one of the most useful report generated by Jmeter to undertstand the load test result.

Label: Name of HTTP sample request send to server

Samples : This Captures the total number of samples pushed to server. Suppose you put a Loop Controller to run it 5 times this particular request and then 2 iteration(Called Loop Count in Thread Group)is set and load test is run for 100 users, then the count that will be displayed here .... 1*5*2 * 100 =1000. Total = total number of samples send to server during entire run.

Average : It's an average response time for a particular http request. This response time is in millisecond, and an average for 5 loops in two iteration for 100 users. Total = Average of total average of samples, means add all averages for all samples and divide by number of samples

Min : Minmum time spend by sample requests send for this label. The total equals to the minimum time across all samples.

Max : Maximum tie spend by sample requests send for this label The total equals to the maxmimum time across all samples.

Std. Dev. : Knowing the standard deviation of your data set tells you how densely the data points are clustered around the mean. The smaller the standard deviation, the more consistent the data. Standard deviation should be less than or equal to half of the average time for a label. If it is more than that, then it means that something is wrong. you need to figure out the problem and fix it. https://en.wikipedia.org/wiki/Standard_deviation Total is euqals to highest deviation across all samples.

Error: Total percentage of erros found for a particular sample request. 0.0% shows that all requests completed successfully. Total equals to percentage of errors samples in all samples (Total Samples)

Throughput: Hits/sec, or total number of request per unit of time(sec, mins, hr) send to server during test.

endTime = lastSampleStartTime + lastSampleLoadTime startTime = firstSampleStartTime converstion = unit time conversion value Throughput = Numrequests / ((endTime - startTime)*conversion) KB/sec : Its mesuring throughput rate in Kilobytes per second.

Avg. Bytes: Avegare of total bytes of data downloaded from server. Totals is average bytes across all samples.
-1

I think this link is helpful for you

http://pushpendrapps.wordpress.com/2014/11/11/how-to-analyze-the-jmeter-performance-report/

1
  • Downvoting because this is a link-only answer.
    – user246
    Commented Dec 20, 2014 at 13:24

Your Answer

By clicking “Post Your Answer”, you agree to our terms of service and acknowledge you have read our privacy policy.

Not the answer you're looking for? Browse other questions tagged or ask your own question.