1

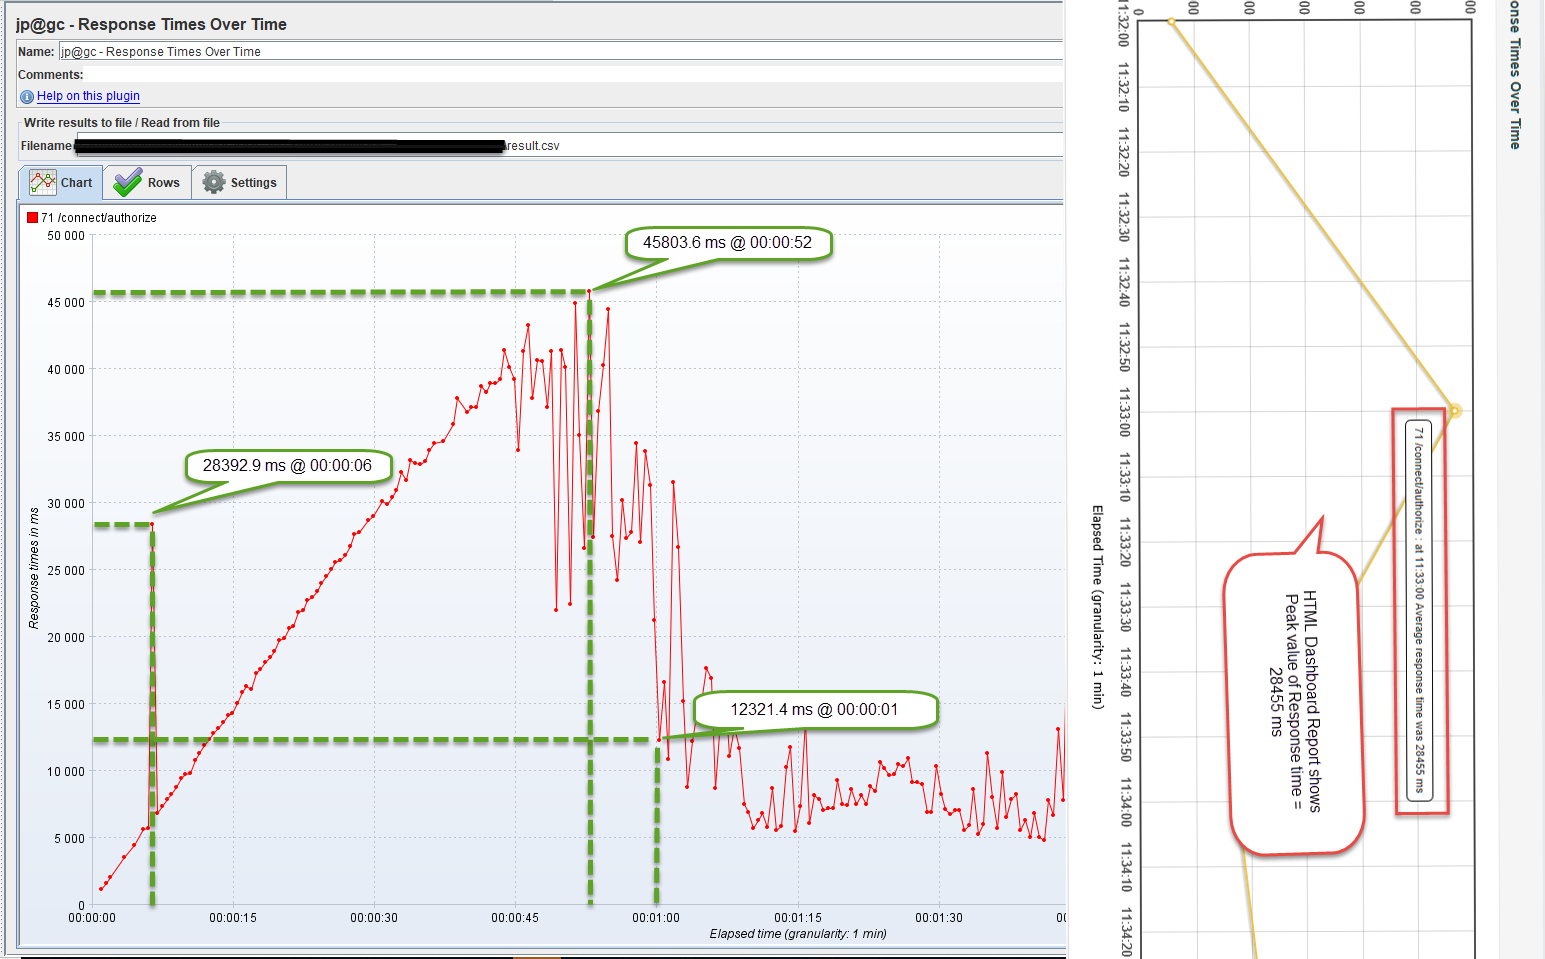
I have observed difference between JMeter - HTML Dashboard Report(Response Times Over Time) and Response Times Over Time Listener. I am using JMeter version 3.3 HTML Dashboard Report shows Peak value of Response time = 28455 ms @ 11:33:00 whereas Response Times Over Time Listener shows peak value of Response time = 45803.6 ms @ 00:00:52.

Both the HTML report and Listener are generated using same result.csv file.

Can anyone please help me understand this. Please correct me if I am understanding this incorrectly.enter image description here
1 Answer 1

1

It is impossible to say what is the cause without seeing the configuration of the Response Times Over Time listener and HTML Reporting Dashboard.

Most likely your dashboard is configured in the way that it "masks" this spike due to high granularity compared with relatively low test duration (1.5 minutes)

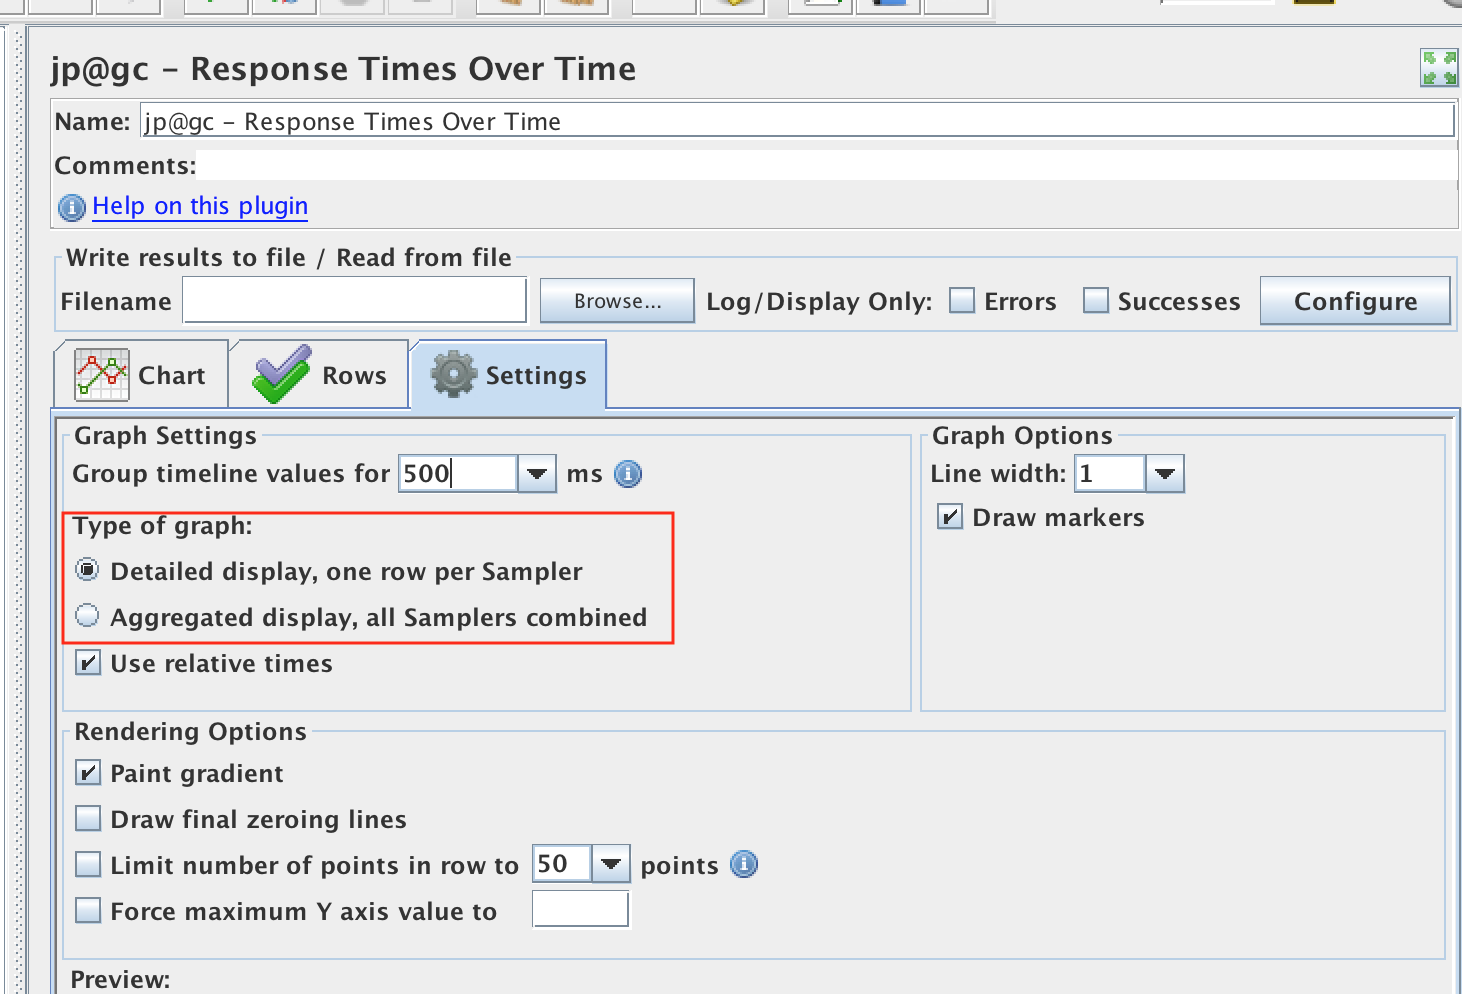
One more place where the differences could be is "Type of Graph" setting of the Response Times Over Time

JMeter Response Times Over Time

Similarly configured graphs generation should produce similar graphs on the same data (unless there is a bug)


And finally make sure that you use:

  1. Latest version of the Response Times over Time plugin (you can check for/install updates using JMeter Plugins Manager)
  2. Latest version of JMeter (JMeter 4.0 as of now)

Your Answer

By clicking “Post Your Answer”, you agree to our terms of service and acknowledge you have read our privacy policy.

Not the answer you're looking for? Browse other questions tagged or ask your own question.