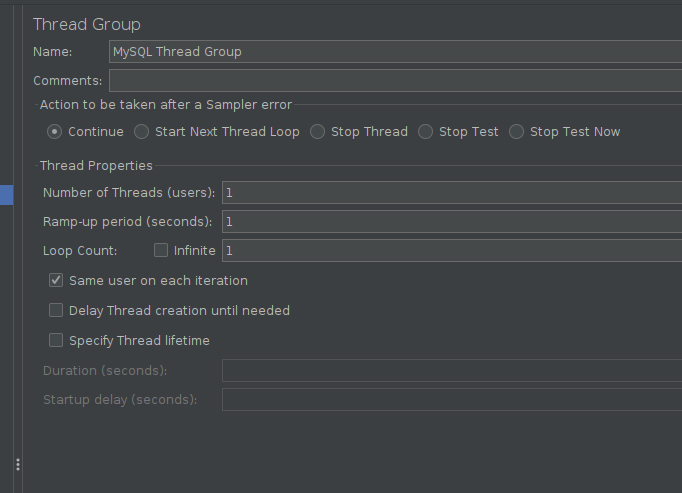
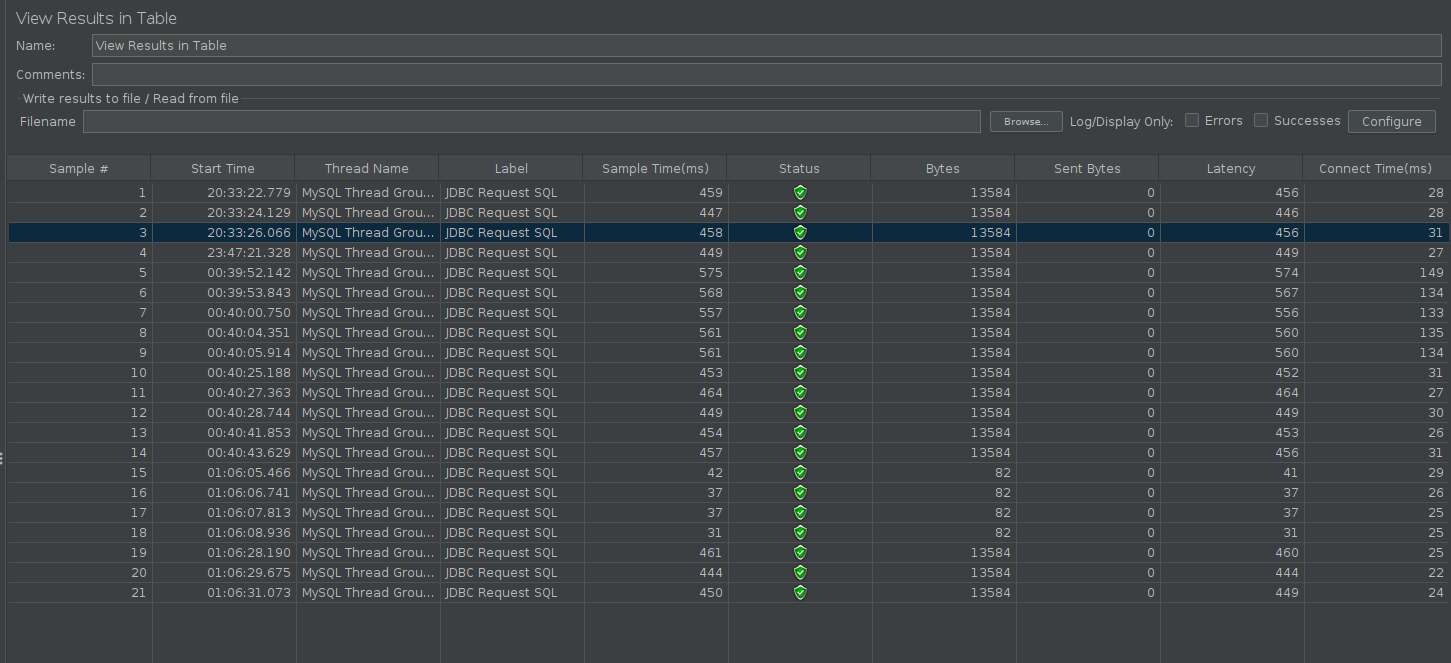
I am testing neo4j and mysql with queries that I want to compare later by latency and sample time considering jmeter as imitation of some web service. I am doing tests for 10000,100000,1000000 rows in database. But no matter which one I choose I keep getting 0 latency for neo4j and sample time comparable to on database direct execution, and very big latency same as sample time (or maximum 1ms less) and comparing to mysql databse showing for example duration/fetch = 0.054s/0.1s it seems to be something wrong. My configuration is really simple, almost default. Is there something wrongly done by me? (do not look for the rows with big connection time, it was a test of something)

1 Answer
- JDBC Request sampler uses AbstractJDBCTestElement under the hood which in its turn calls SampleResult.latencyEnd() function
- Bolt Request sampler uses AbstractBoltTestElement which doesn't call setLatency() function hence you see latency as 0
If you really think that comparing 2 different databases this way is a good idea - stick to elapsed time and ignore latency.
If you believe that Bolt Request sampler should report latency as well - raise an issue in JMeter GitHub
In the mean time you can think what do you mean by "latency" when it comes to Bolt Request sampler and use either JSR223 Sampler with Groovy language or create your own JMeter Plugin basing on the Bolt Request sampler.
-
Thanks for explanation, that makes sense:) so i understand that connect time for bolt request is also not recorded? Commented Sep 9, 2023 at 11:31
-
