0

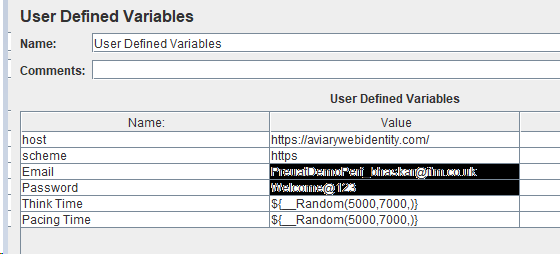
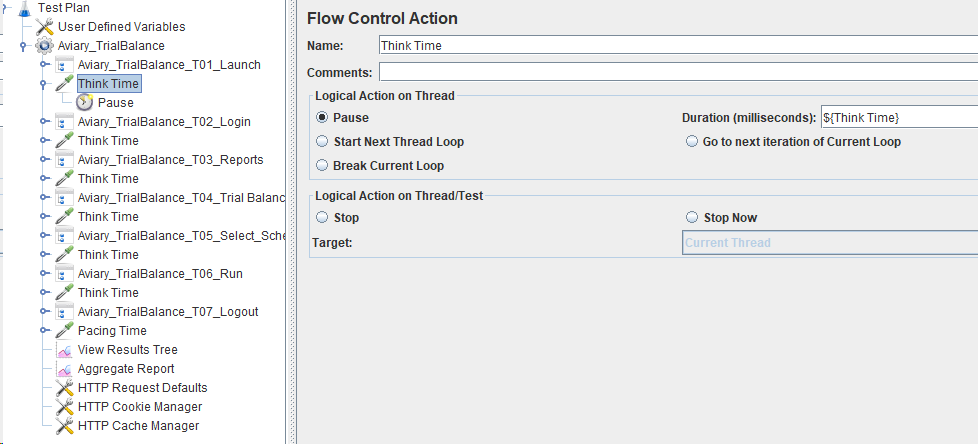
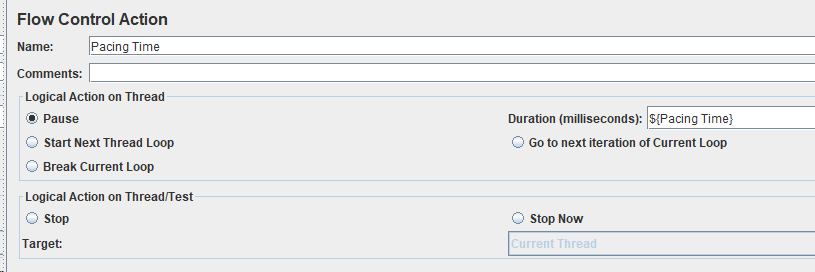
I have recorded the script and run test with 1 VU. Checked the response of the application by using developer tools and the response got in application side and response from the JMeter is same but manually open the Application in the browser the response getting is after 60 seconds but while running the script with 1 VU, Think Time is 5 to 7 seconds and pacing time 5 to 7 seconds, getting the response time is 2.400seconds.

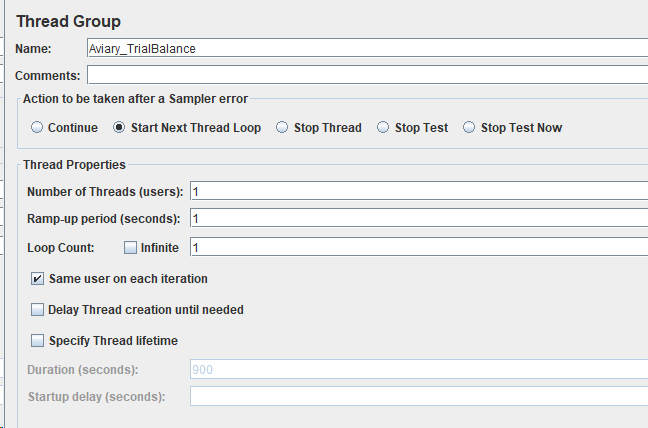
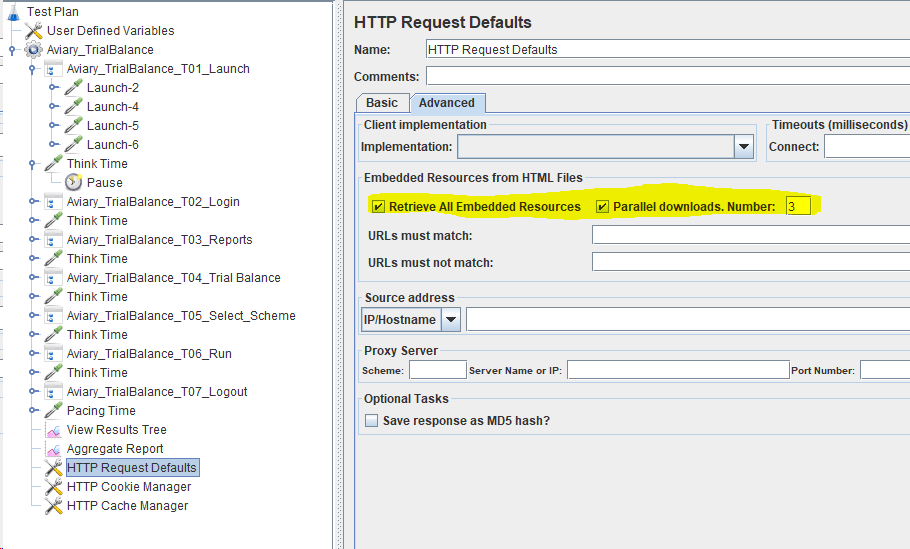
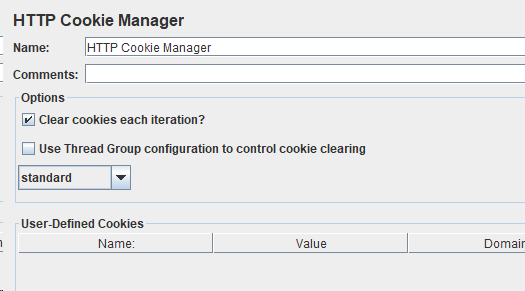
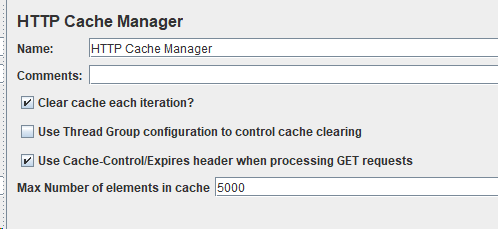
I have attached all the script related screenshots.

Made changes to the script as per the below link but still issue is same

Manually Application Vs Jmeter reports differences

Could anyone please help me
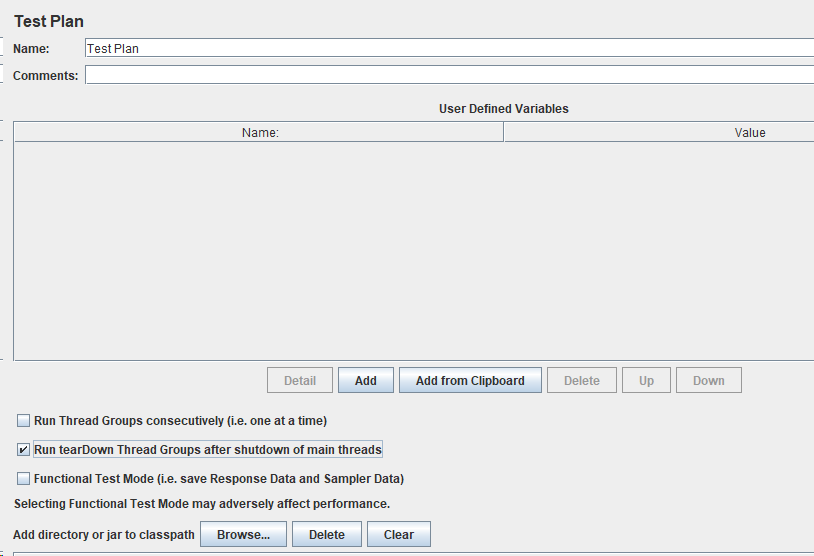
enter image description here enter image description here enter image description here enter image description here enter image description here enter image description here enter image description here enter image description here enter image description here enter image description here

1 Answer 1

0

Your question is not clear. We need to see the response(s) from your browser developer tools and from JMeter's View Results in Table and View Results Tree listeners in order to be able to help. Better in form of .har and .jtl results file with request and response data included.


JMeter's elapsed time does not include any pre-processors, post-processors or timers execution time unless you put everything under the Transaction Controller and configure it to do so.

Your Answer

By clicking “Post Your Answer”, you agree to our terms of service and acknowledge you have read our privacy policy.

Not the answer you're looking for? Browse other questions tagged or ask your own question.