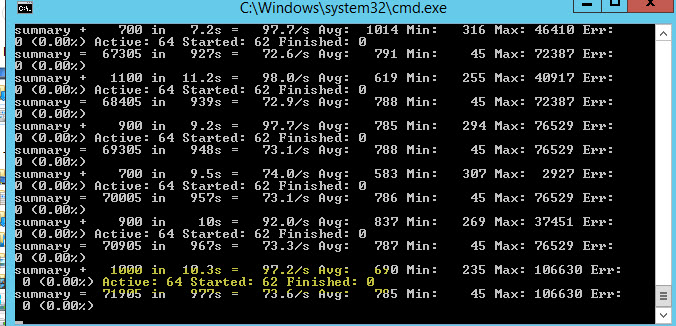
I am testing using a Master-Slave Configuration. When I look at the output on the master test machine, when I start the test, it typically shows 64 threads started. Recently it seems like it was showing 63 out of 64 Threads Started. I just started another another test and this time it was showing 62 out of 64 threads started. What should I be looking for. Below is a snapshot from the master test machine.
1 Answer
Let me start with little background.
The image which you have displayed in your question this is called as the 'Summarizer' and it is shown on in the Non-GUI mode of JMeter execution. You can configure this (like its interval etc.) from the JMeter.properties file.
In this view, The lines with “summary +” are incremental for the latest summarizer period, the lines with “summary =” are cumulative. (courtesy to links Link1 and Link2) i.e. if your Summarizer interval is 5 secs then this summary is shown after every 5 secs and "Summary +" will show the incremental value from the last summary (i.e. the summary value 5 secs ago + current values).
Further, you must have seen that these values "Active, Started, Finished" are shown only with "Summary +" line
Now, coming back to your question, first of all you don't need to do anything with this summarizer view, as this is only for command line and your actual results are saved in the .jtl file you are creating.
But still to begin with the explanation, the number just next to "Summary +" is the number of request which will be used for your Throughput (like from your image (900/9.5 = 97 requests/sec),
- Avg: is the Average response time value at that time
- Min: is the Minimum value of response time
- Max: is the Maximum value
- Err: is the Error percentage in your requests (if there is any)
- Active: is the total number of threads which are currently active, i.e. they may be doing some work over the application
- Started: is the total number of threads Started by JMeter till that Summarizer time (usually what I have seen is that Started >= Active, as a thread which has not got started how it can be active (normal thread group case) "but not sure about Master Slave/Distributed load")
- Finished: is the total number of threads which have exited the script, or their work has got completed (so, for a normal thread group configuration ideally; Active + Finished = Started)
Example:- Lets say Thread Group count = 30 Ramp-up = 30 Loop Count = 1
When this is executed (with summarizer interval as 3 secs), then after every 3 secs you will get "Summarizer +" entry over command prompt
00: Active: 3, Started: = 3, Finished = 0

03: Active: 4, Started: = 6, Finished = 2

06: Active: 2, Started: = 9, Finished = 7

..... so on till

xx: Active: 0, Started: = 30, Finished = 30
Multiple factors may affect this behavior like:
- This all was a scenario from a normal thread group, for Stepping, Tear Up etc. thread group (it should be same, but I am not sure)
- Master Slave Configuration/ Distributed Load (there may be multiple slaves, sharing the thread count, but any slave might have unfinished threads affecting count)
