1

Basically many people know the problem that the project owners would like to see the progress of the test.

Technically via test suites, via CI integration possible, reports.

But how does it behave when the PO asks (at the end of the year) what the testing, test team has achieved for him?

How can I measure in detail how successful we have worked?

5
  • 2
    What problem is your P.O. trying to solve with this information? Additionally, I would be careful in using the words "measure" and "productivity" - they may lead people to look for quantitative data rather than qualitative data. Depending on the background of the people involved, they may ended up asking for bizarre data like "test case execution rate" and "pass/fail ratio". As you said "what people achjeved" seems to me less likely to drive to this path. Commented Nov 25, 2020 at 16:11
  • Well, the P-O. wants to plan his business for the next payroll year. Of course he also has to look at costs on the one hand, but also at the productivity of the test team. And that is exactly why he needs a corresponding measurement rate.
    – Mornon
    Commented Nov 25, 2020 at 16:23
  • On the one hand, we can measure the agility of a team, but sometimes you have to think more globally in the company. Do people have to be hired, are the current people enough, do we need to make adjustments?
    – Mornon
    Commented Nov 25, 2020 at 16:25
  • 1
    Ok. Since we are talking about the past, which data about speed do you have? Session-based Test Managment, lead time and cycle time of tasks? Commented Nov 25, 2020 at 18:31
  • We have session-based test management, and yes, a task turnaround time, including exploratory testing.
    – Mornon
    Commented Nov 26, 2020 at 12:52

6 Answers 6

1

When your Product Owner ask a general question on how you QAs performed this year, you need to give three dimensional answer:

  1. Estimation that gives the results of entire team (Refer no.1 section in answer)

  2. Estimation that gives special efforts from QA (Refer no.2 section in answer)

  3. Estimation specific to Test Automation (if any) (Refer no.3 section in answer)

1. Important Estimations for the Agile Testing Activities: Velocity Chart includes testing activities as sprint story and tasks

Test Estimation Formulas in Agile Testing Projects

Once you have worked in the team for some time using some method you can then calculate the velocity of the team. ‘Velocity in simple terms means how many story points on an average can we manage to finish in one sprint of a particular length with X number of developers.’ With time the calculation will get better and better and your predictions will then get more accurate. Personally me and my team currently have a favorite method called ‘sorting poker’ method. We mixed two methods available out there and made one of our own. What we do in our sprint planning is first we go through all the stories to be done in the backlog in this sprint and then identify the smallest task on the board. After that we start sorting all the other stories with regards to the smallest story and sort it in ascending order. Once all the stories are sorted we start with planning poker. Everyone in the development team gets to pick one number for the smallest story. If there are different number, then we put time for discussion and agree on one smallest number for the story as our base story point for the sprint. Then we move on to the second story which is identified as slightly bigger than the smallest story and we play poker again, decide on a number when everyone is in agreement. When we move on to the 3rd story we remove the number used for the smallest story if the second story point was higher than the first one. This makes its so much easier to estimate further stories. Surely, it takes time for going through all the stories and sorting it in the beginning but when we utilize the first hour of our meeting doing the sorting the estimation goes so fast that we sometimes finish the sprint planning way before time as the estimation then becomes super easy. Pro-Tip: I usually have a pre-sprint planning with my development team where I do a walk through for them explaining them the user stories and the goal. I usually do this one week before to the sprint planning just for an hour and then give them that week to think about how we can achieve that goal. This makes it easier for all the developer to come up with the easiest solution and also think through multiple variation of possibilities before the sprint planning.

Sources: https://engineers-hub.teachable.com/p/istqb-agile-tester https://productcoalition.com/how-to-estimate-user-stories-95f4b3d73da

  1. Test Estimation on various Test Estimates and respective calculation:

Case: Surendar Singh, a test manager of Aditi Solution Tech. Ltd. has planned three weeks testing of 15 working days to complete the testing cycles of approximately 850 test cases. It has been planned as follows: 850/(154)=14 test cases per person/per day, henceforth, he has targeted at least 15 test cases to be performed to meet the deadline. Paul from the team has gone in surprise leave on the very first week for 4 days and this would have affected 414 test cases =52 test cases of the project in a particular module. As a twist to the story, another team staff has gone in sick leave for two days in the middle of the test cycle which created additional backlog of 28 test cases on top of 52 existing backlogs, and Surendar has no other option than increasing the duration of the project at the last week which has created tension around the delivery date. This situation shows a clear example of poor planning from the test management. If leaves were organized earlier and Surendar had planned at least 16 working days of tests to include 2 days as backup, then it would have sort out the leave issues on time. Because the total backlog of tests 80 (means 52+18) would have executed with the help of last working day availability.

Source: https://books.google.co.uk/books/about/Software_Automation_Testing_Secrets_Reve.html?id=o__pvwEACAAJ&source=kp_book_description&redir_esc=y

**

  1. Test Automation Estimation Techniques:

**

Time and complexity for a given testware architecture implementation While the effort estimation for a TAS project is the responsibility of a TAM, a TAE needs to support a TAM in this by providing good estimates for the time and complexity of a TAA design. Methods for estimations and examples include the following:

  • Analogy-based estimation such as such as functions points, three-point estimation, wideband delphi, and expert estimation
  • Estimation by use of work breakdown structures such as those found in management software or project templates
  • Parametric estimation such as Constructive Cost Model (COCOMO)
  • Size-based estimations such as Function Point Analysis, Story Point Analysis, or Use Case Analysis
  • Group estimations such as Planning Poker

Source: https://www.istqb.org/downloads/send/48-advanced-level-test-automation-engineer-documents/201-advanced-test-automation-engineer-syllabus-ga-2016.html

https://engineers-hub.teachable.com/p/istqb-advanced-level-test-automation-engineer-professional-training-with-q-a

https://www.youtube.com/watch?v=vTRUXAd7E4U (Very Important Reference)

ISTQB Test Automation Engineersing Syllabus from ISTQB Board

3
+25

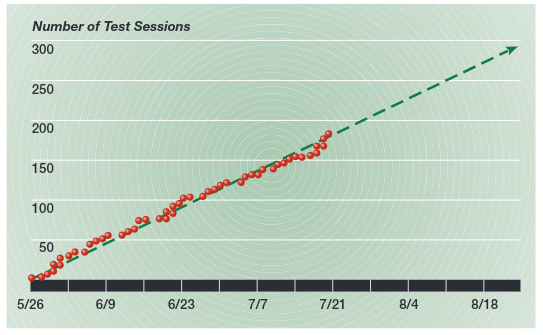
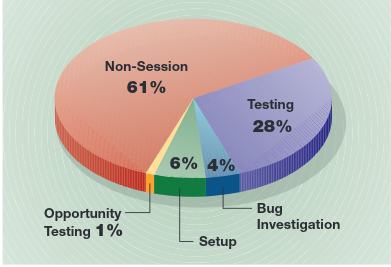
Since you have Session-Based Test Management, you can use your test sessions data to show your team's testing capacity.

For example:

  • You can plot the number of sessions your team did throughout time. Downtrends may intigate your team is having problems to keep a steady pace or that your testability has improved, demanding less test sessions for the same results.

    Normalizing these data with other team capacity metrics, such as number of people involved or story points (if you can very consistent and mature with them) may make this chart more precise.

enter image description here

  • You can also breakdown the type of work done in each session, to tell a story about issues your team may face with testability and reportability.

enter image description here

You can find more details on James Bach's article on Session-Based Test Management.

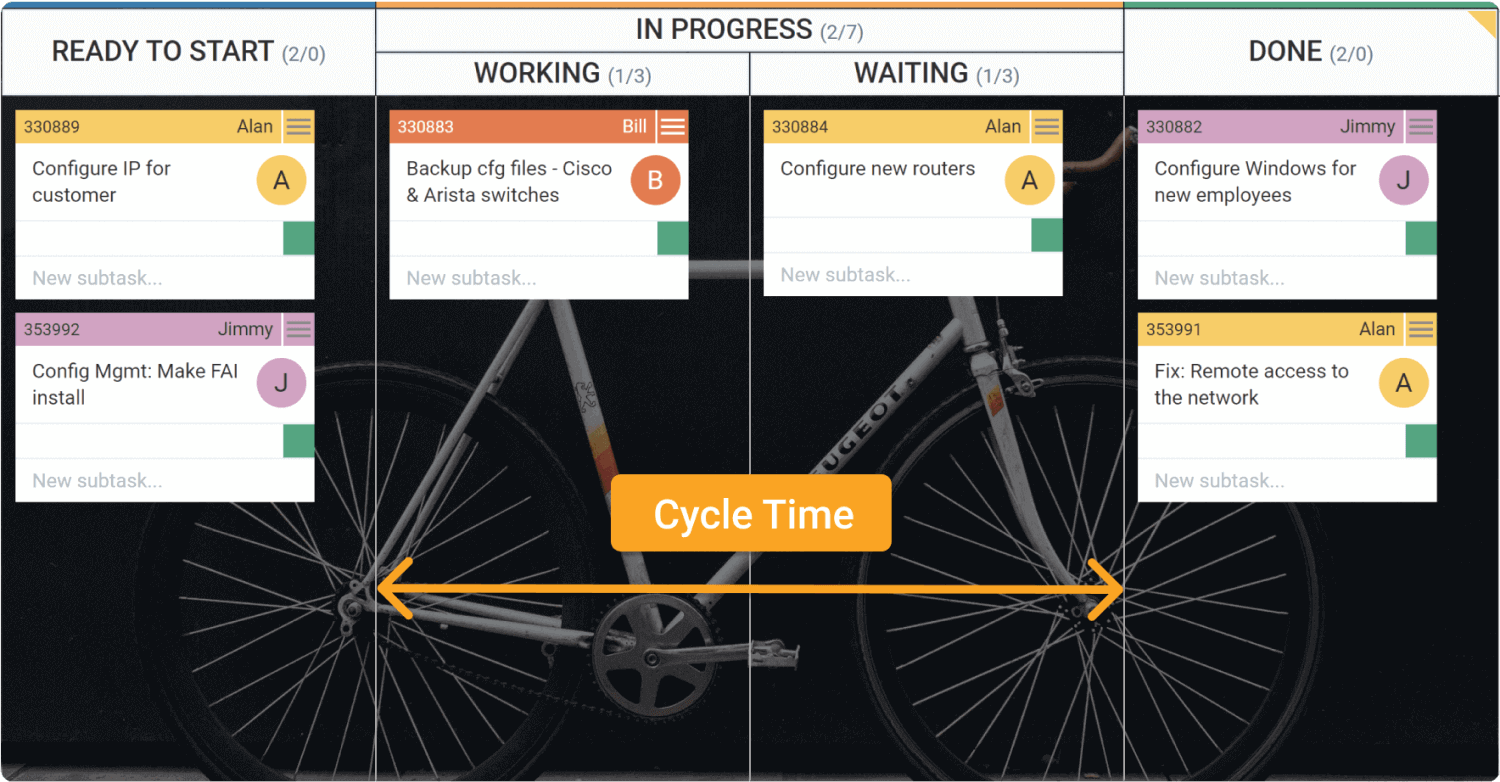
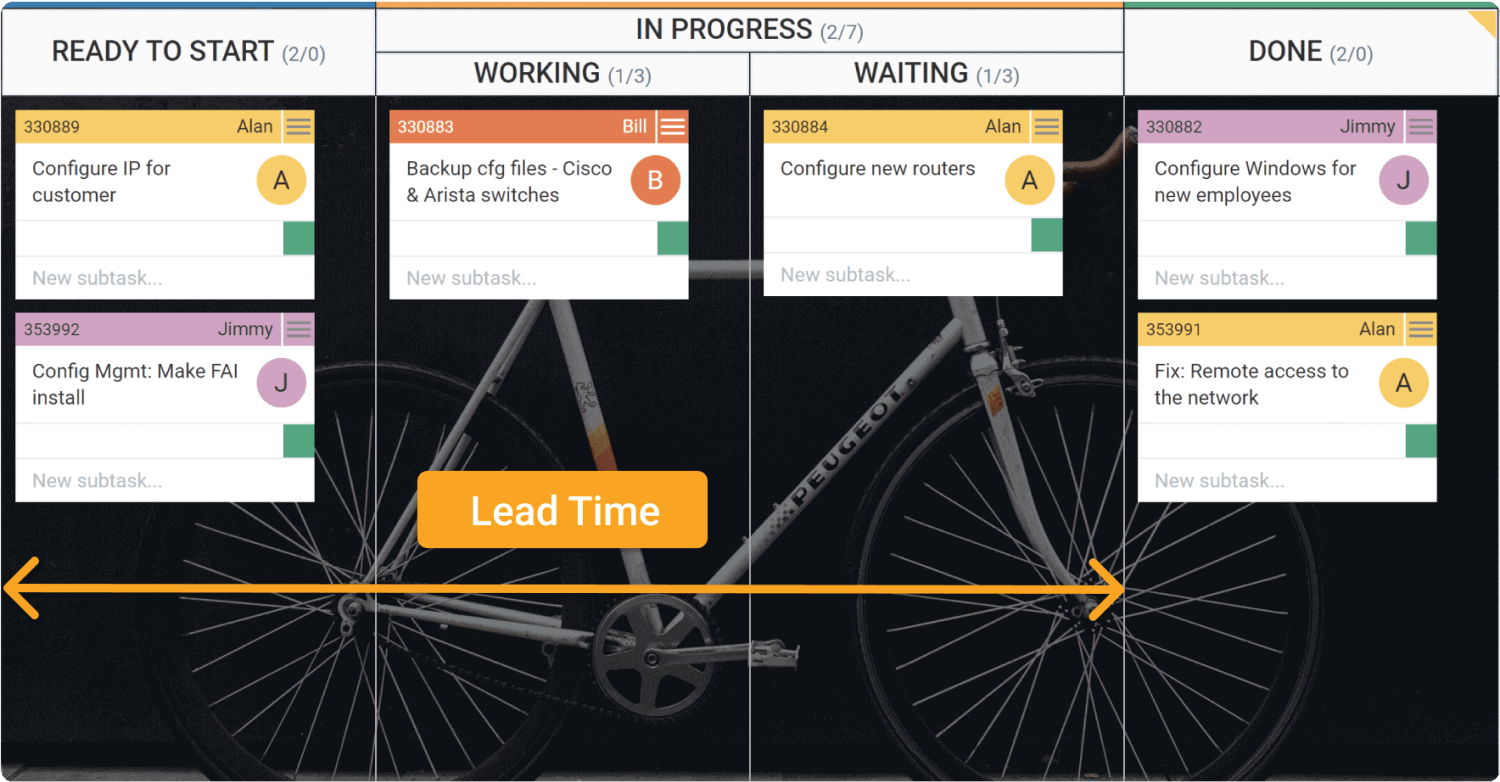
Also, Kanban metrics may be useful:

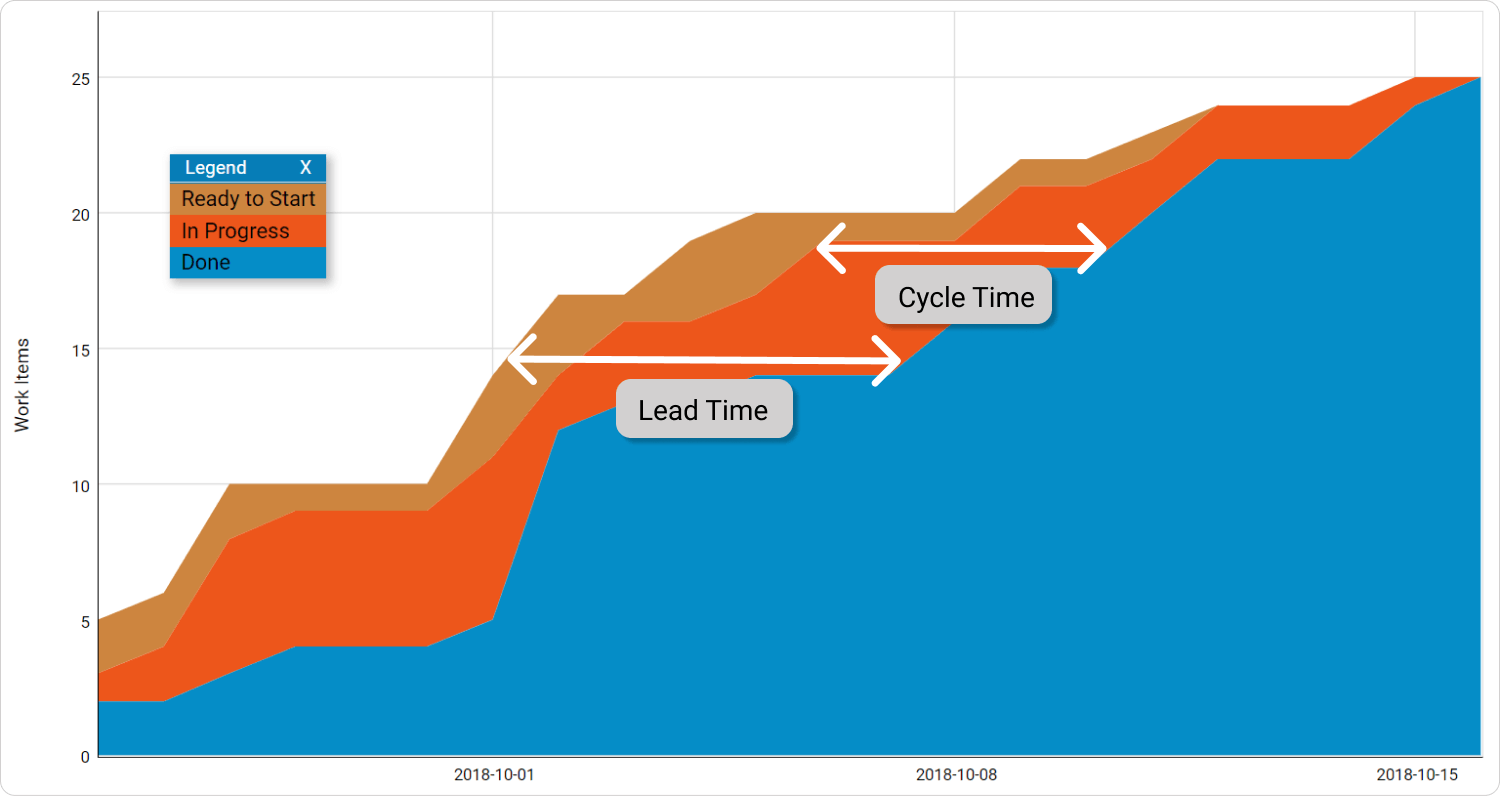
  • Cycle time will show how long your team takes to finish a task from the moment it starts.

enter image description here

  • Lead time will show how long your team takes to finish a task from the moment it appears. It complements cycle time to show possible problems in keeping new business needs for too long before it starts to be worked on.

enter image description here

In the end, you can have a cumulative flow diagram. It indicates bottlenecks in a delivery pipeline. You can see below, at 2018-10-01, the In Progress color occupies a large part of the chart. It indicates your team was working in a lot of items at the same time, without delivering to Done. It would indicate you may have a story about people switching focus too often during the day, getting requests from many sources.

enter image description here

More details here.

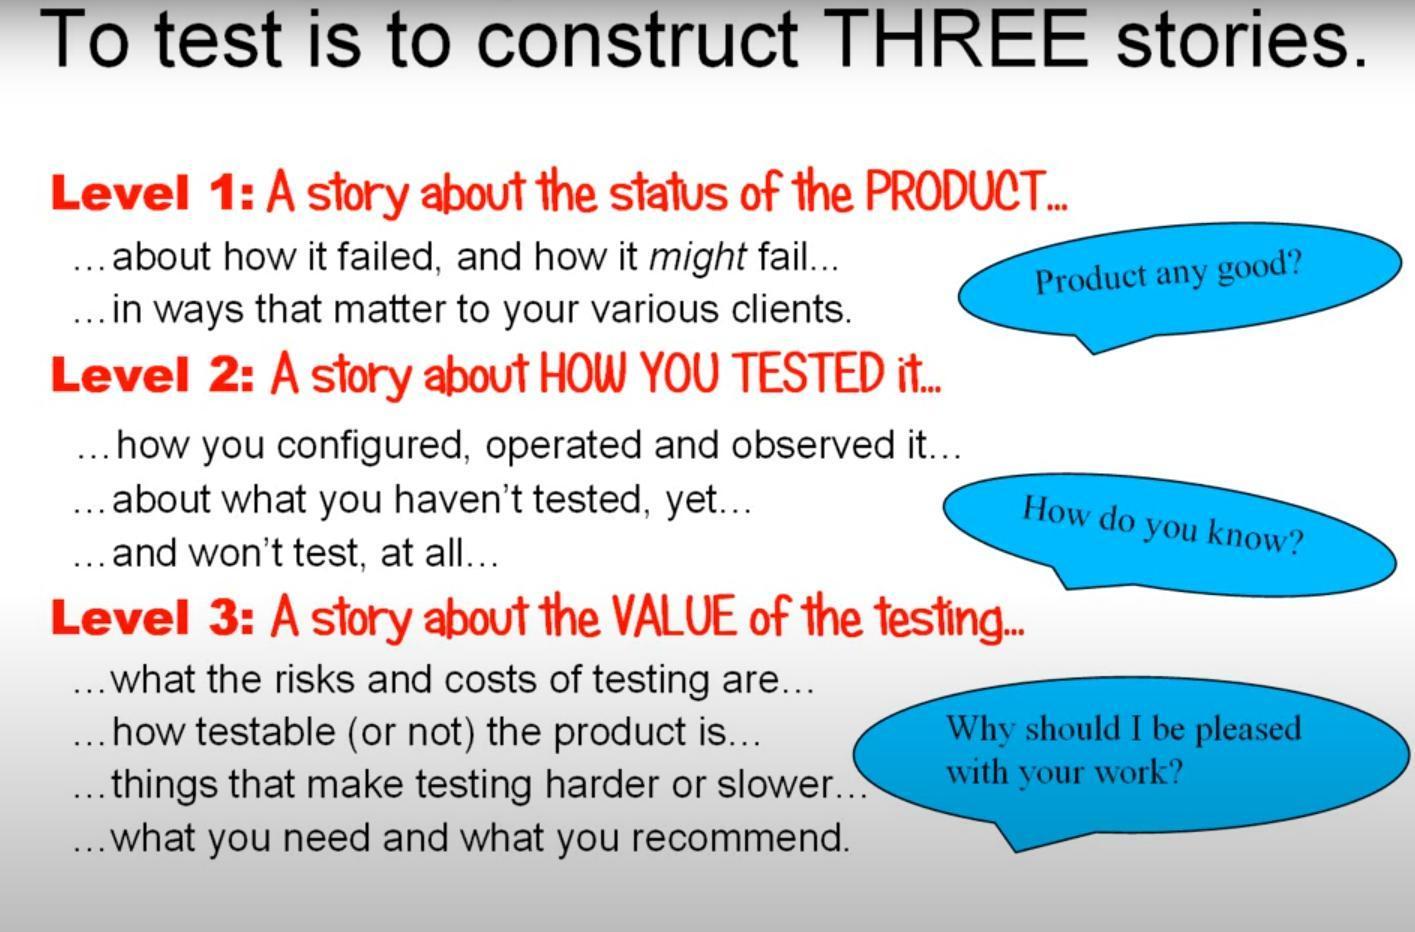
On a final note: Don't count lines of code or number of bugs. Use any data or chart you have to tell a story about testing. Focus on creating adaptability, optionallity, and experimentation. Identify what issues you have and see coming, and prepare yourself to remove those impediments to good testing. You may identity that you gonna need to put more effort in setting up better code quality analysis, or solve communication issues, or test labs issues. These problems may be solved be hiring people with new skills, or changing focus, or changing roles inside the team. You will know what works best to your particular context by experimenting, throughout time.

enter image description here

1

How can I measure in detail how successful we have worked?

While there are many useless metrics that could be cited her, IMHO there is only one (semi) useful metric of success... number of bugs that have made it into the wild.

  • If the answer is none, then the team has done its job. Successfully.
  • If the answer is lots, then the team has not done its job.

The likelihood is a measure somewhere in between, so it is up to the PO to decide which side of an arbitrary threshold you lie.

ETA:

the P-O. wants to plan his business for the next payroll year

An unsuccessful year would suggest, in future, you need to do more (or smarter) testing...

If the PO suggests cutting testing, make sure you ask if his budget factors in more bug-fixing time (and depending on your domain, potential product recalls)

5
  • Basically correct in all points. It seems that there is no other metric to measure it more accurately than the classical methods, such as the number of errors found, time expenditure, and other measurable factors.
    – Mornon
    Commented Nov 25, 2020 at 19:52
  • But the question is, why? At least from the agile development that can be measured, one could and should deduce this. But a global measurable metric would be very important in such business and QA topics.
    – Mornon
    Commented Nov 25, 2020 at 19:54
  • "Errors found" is a measure of the (lack of) success of the development activity, not the testing activity... "Time spent" is useless, as no-one knows whether one more or one less hour would have made a difference, and a better tester would probably use that time more effectively anyway. It's like "Source Lines of Code Written" is the most useless metric for coders, but probably the most well known
    – Andrew
    Commented Nov 26, 2020 at 6:56
  • @pavelsaman - thanks for spotting the typo.
    – Andrew
    Commented Nov 26, 2020 at 6:57
  • 2
    Note you can minimise number of bugs that made it into the wild by rejecting everything. As soon as you make a measure a target, it ceases to be a good measure.
    – jonrsharpe
    Commented Nov 26, 2020 at 11:39
1

Productivity is to be measured in terms of both a. Quality and b. Efficiency.

a. Quality:

  1. Defect density: (Number of defects found in production or by end customer) / (thousand lines of new code written). The lower this number, the better the quality of your testing.

  2. Defects found: (Number of defects found in the year, bifurcated by severity).

This is relevant for your situation whereby you can show the value the QA team has created. As per a credible research, treating a defect found in production costs 10x more than one found in testing stage (excluding the business impact i.e. customer churn or growth). So you can show the value your team has created by preventing all these bugs to go into production.

b. Efficiency:

  1. Testing velocity of new code: (Thousands lines of new code tested) / (Number of testing hours spent)

  2. Testing velocity of old code: (Thousand lines of old code tested) / (number of testing hours spent)

There are ways to improve your testing efficiency but that is answer for another question.

Lastly, to make a reliable report you must have an organized record of your last year's testing activities that includes number of test cases written and executed and their outcomes (passed/ failed/ other). If you are already using a test management tool, you can have a reliable report of last year's data. If not, there are quite a few options in open source (e.g. Testlink) and commercial. Our team has been using Kualitee for keeping a repository of test artifacts and test execution.

2
  • Are there any appropriate tools that can internalize this? Do you know corresponding tools or processes?
    – Mornon
    Commented Nov 26, 2020 at 10:19
  • 1
    Developers, in general, don't use number of lines of code as productivity for a reason. And putting it together with "number of bugs" makes it an even more useless number. "Garbage in, garbage out". Testing is about risk stories, no artifacts handling. I would recommend James Bach's articles "Risk and Requirements-Based Testing " for more details. satisfice.com/download/risk-and-requirements-based-testing Commented Nov 27, 2020 at 20:04
1

As mentioned in this article, for those in tech, there are great frameworks that highlight many productivity metrics you can use. Agile covers a good bunch of them, including the following:

Velocity

This is the word you’ll read in every article if you google “how to measure team productivity in Agile.” For a good reason. Velocity shows the amount of work a dev team usually completes in a sprint, a set period of time defined within Scrum. By monitoring velocity, you get the general idea of whether the team maintains its average productivity over time.

From To-Do to Done

If deadlines are tight or you have to prioritize quantity over quality for some reason, track the time it takes to move from “to-do” to “done.” This is also a nice control measure to combine with your core quality-focused metrics.

Feature usage index

A great fit if you’re rather focused on the customer perception of what your team creates. The feature usage index shows how people interact with specific parts of the product or functionality, which will subsequently impact the “what” of your development backlog.

Team happiness index

A very overlooked yet important metric of all Agile methodologies. If your team works in Scrum, it’s easy to facilitate team happiness tracking within regular meetings called Sprint Retrospective. Make sure you give your team a chance to express what feels right, what feels wrong, and what they would like to do more. This will surely enhance the commitment and, eventually, boost productivity.

0

This is a common question in a qa company. For that purpose, you need to have the metrics that covers the following:-

  1. Number of delivered defects/test execution per team member vs number of delivered features per team member
  2. Number of business days on average that a feature is in the process as well as in a stage

With these metrics, you can always know:

  • Total throughput per team member
  • Work in progress at any time Speed
  • Speed of work through each sprint or cycle

Your Answer

By clicking “Post Your Answer”, you agree to our terms of service and acknowledge you have read our privacy policy.

Not the answer you're looking for? Browse other questions tagged or ask your own question.