What settings do I need to use so I can check latency time in Jmeter?
2 Answers
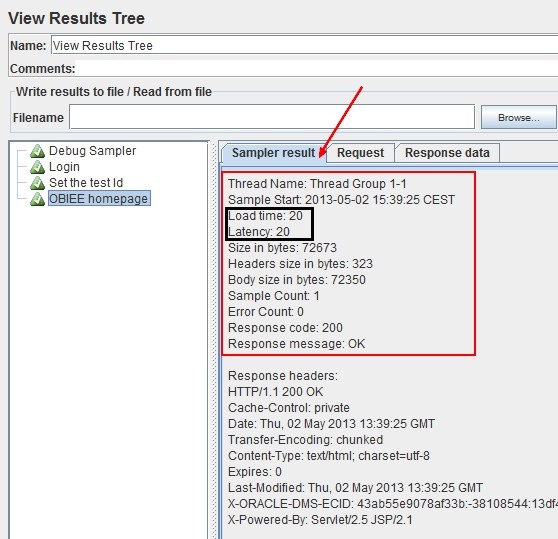
You need to use the Tree listener and/or Table Listener in JMeter, Sampler result tab of Tree listener provided the value of both "Latency Time" and "Load Time"
(this image has been taken from google and just for reference, Tree listeners looks exactly same)
This lisnter will provide the result of individual samples, i.e. you have to select the sample one-by-one for Latency time.
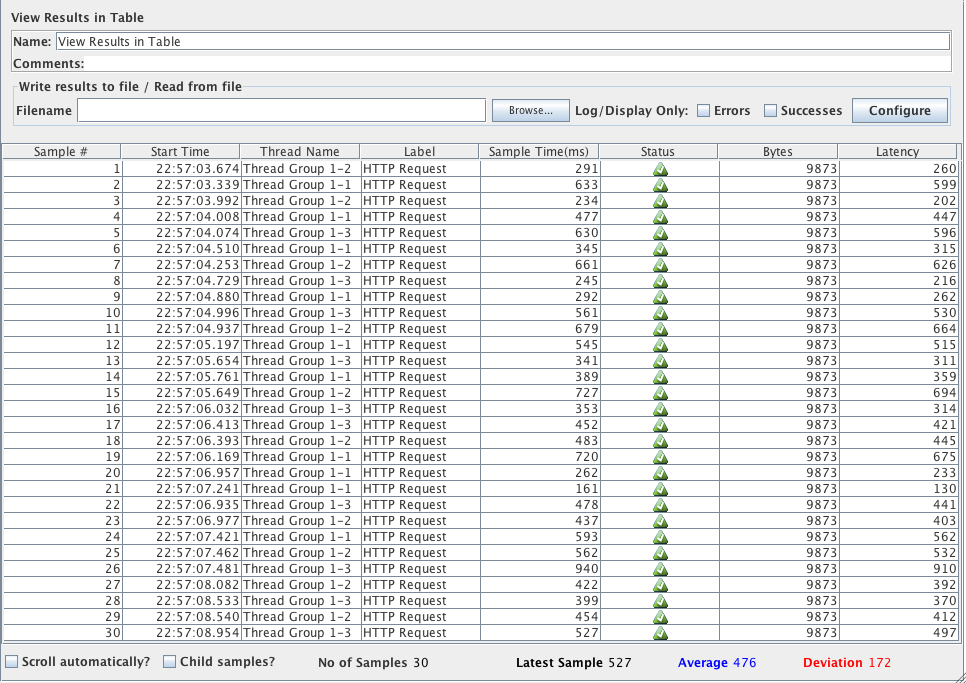
If you want Latency of each request in one go, you need to use the Table Listener.
Latency is a difference between time when request was sent and time when response has started to be received.
Response time (= Sample time = Load time = Processing Time + Latency Time) is a difference between time when request was sent and time when response has been fully received.
Refer these links
https://stackoverflow.com/questions/18510846/jmeter-latency-vs-load-timesample-time
A little amendment to Dhiman's answer:
- Don't use View Results Tree and/or View Results in Table listeners for anything but tests development or debugging as they are very resource intensive.
- Don't use JMeter GUI for actual load test, use GUI only for tests development and troubleshooting as again GUI thread consumes a lot of resources and can ruin your test.
If you run JMeter in command-line non-GUI mode as
jmeter -n -t /path/to/your/testplan.jmx -l /path/to/testresults.jtl
it will produce results file like:
1439751824751,4771,HTTP Request,200,OK,Thread Group 1-1,text,true,1591,1,1,4771
Latency is the last column, in above case it's 4771
Field names are:
timeStamp,elapsed,label,responseCode,responseMessage,threadName,dataType,success,bytes,grpThreads,allThreads,Latency
You can "tell" JMeter to print field names in CSV results file by setting the following property:
jmeter.save.saveservice.print_field_names=true
Once test completes you can open testresults.jtl file with the listener like Aggregate Report and perform analysis as normal

