2

We have a WCF Restful web service which communicates with thousands of hardware endpoints. These end points communicate on daily basis with the service within a time span of 5 hours.

There are about 13000 endpoints currently and its increasing day by day.

I have to make sure that even if on some day the endpoint count increases to 50000 or 100000, the WCF web service should be able to handle it within the same time span of 5 hours or even less.

I am running a script i.e I am hitting the service with JMeter, but what should I explain the Client about the performance.
1
  • Is the Client your stakeholder - the person who expressed the concerns and as a result you do performance testing - or somebody else from a more broader context? Commented Aug 12, 2015 at 15:36

2 Answers 2

4

You should show them a report in which you include

  1. Response Time (if there is any kind of SLA with client that each of the 13000 users will get a response in X seconds). If this doesn't matter in how much time users are getting response then leave this value.
  2. Based on the result of Response Time mark your test as Pass or Fail in your report. If your Result > X then Fail, else Pass
  3. Add Throughput to show them server capacity in increasing way i.e. run your script for different set of you users (10000, 13000, 15000, 20000) and show them how server capacity is getting impacted.
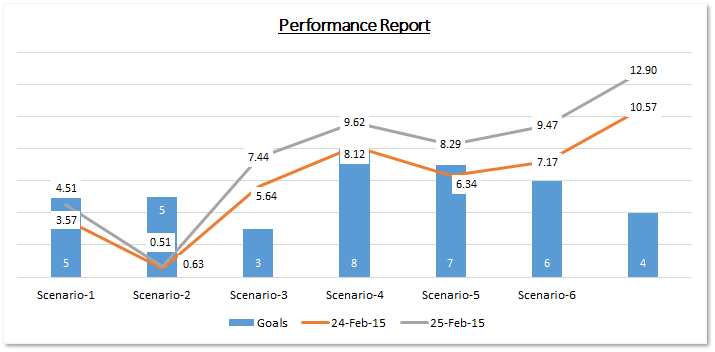
  4. You should present your report in a Graphical format (Bar chart or line graph), there are two reasons for this:-
    • Client and management generally understands, like and get impressed by graphical reports
    • Graphs are easy to interpret and trend line for the low and higher load can easily be generated from graphs
  5. In your report, provide results for multiple iterations and rounds
  6. If you know that in future the count of hits may increase to 50,000 then in your report add results for values more than 13,000. It will show that you have results for future analysis too and it will help in scalability part of the application.
  7. Add Resource utilization values too to your reports but in a separate sheet like CPU utilization, Memory usage, Network I/O etc. and highlight the bottle neck, if any.
  8. If there any errors in your result, then highlight that, for example if at 20,000 users you have response time more than SLA or 5000 requests are failing then highlight this thing in your report. Better to use percentage value that for 20,000 records 20% samples are failing. Don't hide errors as revealing such things later on or if application fails to complete 20,000 requests in future then it will be a question and issue for your report.
  9. Keep your report and graph simple, do not add too many bright and different colors.
  10. Tell them all the Risks in application through your report, may be separate sheet. So, that ball is not in your court and team (including client) can define any mitigation plan for the risks. You work is to provide results with all analysis and providing suggestions through your report, by raising flags. It is the work of team (management) and client to decide further action plans.
  11. Add only those values and points which you can explain, don't add bluff to your report. Client generally asks questions about the report and things related to that. Not answering any question will be -ve point on your side, so take your time and read more about the result values before scheduling any meeting.
  12. Get your report reviewed and spell checked before presenting it to client. Correct the formatting. Don't add too much values e.g. its not required to copy-paste the complete JTL file in report, don't add all values like 90%, Average, Max. Min. etc. As this will create a lot of confusion and will make a mess in report.
  13. Add preface and introduction chapter to your report, this is a thing which may not be noticed but should be included in report to briefly describe your Performance Plan, Approach and Steps taken by you. Tell them:
    • What is Response Time?
    • What is Throughput value and its impact?
    • Challenges faced (if any)?
  14. Last not least, make your report robust i.e. use formulas in your excel report in such a way that if client asks you to create a new report after some performance tuning, then you just need to copy-paste values from the JTL file and all your graphs, tables and other results should get populated automatically.

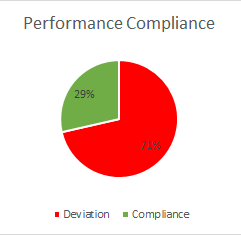
Below is an example of report

enter image description here

enter image description here

3
  • Hey Dhiman, Should I use Summary Report listener? If yes, it doesn't show response time, how to calc that?. Also in your graph which attribute you chose for blue towers, blue line and orange line?
    – paul
    Commented May 17, 2016 at 6:54
  • 1
    @paul I have used the Aggregate Report Listener and then you can create graphical report in Excel. See the graphs which I provided are just for example, you can change/modify them as per your need and your target audience.
    – Dhiman
    Commented May 18, 2016 at 14:18
  • I am new to jmeter, dont whats good/bad reports. But both of these looks good. Please share which attribute in your chart is blue building blocks and which ones are orange and blue lines. Share pie chart also.
    – paul
    Commented May 18, 2016 at 14:34
2

JMeter result files are quite plain and some postprocessing is required to make them readable and understandable. Usually of interest are following metrics:

  • Perceived system performance
  • Perceived user experience
  • System performance

See Performance Metrics for Websites guide for above and more metrics highlighted and explained.

Here are some approaches on how you can visualise results to you could demonstrate them to someone else:

  1. Use custom Listeners provided by JMeter Plugins project. See Automatically generating nice graphs at end of your Load Test with Apache JMeter and JMeter-Plugins article for example on how it can be done
  2. Use Loadosophia.org cloud service where you can upload your test results and get the output in nice and professionally looking form. You can check out some examples to get an idea how it will look like. Also there is an option to export results as PDF file.

Of course first of all you need to take a look at results by yourself and if there are any issues - raise them and include into the report.

Your Answer

By clicking “Post Your Answer”, you agree to our terms of service and acknowledge you have read our privacy policy.

Not the answer you're looking for? Browse other questions tagged or ask your own question.